


Support resistance drawing mistakes are one of the main reasons an MSNR chart looks clean in hindsight but feels confusing in live execution. A beginner may draw many lines, wait for price to touch one of them, and then wonder why the setup fails. The problem is usually not support and resistance itself. The problem is that the level was drawn without enough structure, context, invalidation, or trade plan.
This guide is written for beginner to intermediate retail traders who use MSNR, Malaysian SNR ideas, price action, or simple support and resistance trading. The goal is practical: avoid wrong support resistance lines, reduce SNR drawing errors, and build a cleaner chart-reading workflow before taking a trade.
For the full framework, read the complete MSNR trading strategy guide. You can also connect this topic with the best timeframes for MSNR levels, SNR level invalidation, and what MSNR trading means.
Trading involves risk. This article is educational only and is not financial advice, investment advice, or a signal to buy or sell any market. Support and resistance zones can fail. Stop-loss orders and other order types also have execution risks, especially in fast markets. For basic order-type education, see Investor.gov’s order type guide. Always define invalidation, use position sizing, and test rules in your own market conditions.
What Support and Resistance Drawing Mistakes Mean in MSNR
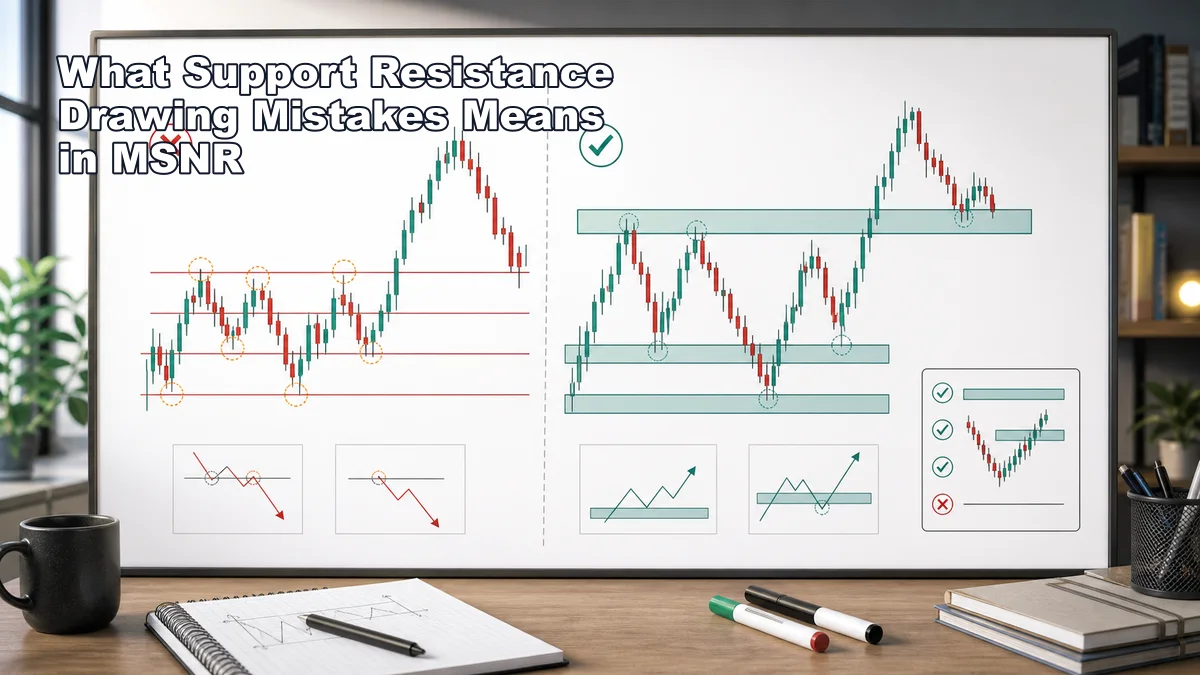
In MSNR, support and resistance are not decorations on a chart. They are decision areas. A support zone suggests buyers previously reacted with enough strength to matter. A resistance zone suggests sellers previously reacted with enough strength to matter. A good zone helps a trader decide where to watch, what reaction to wait for, and where the trade idea becomes invalid.
A support resistance drawing mistake happens when the trader marks a level that does not deserve that role. The line may come from a random wick, a small candle in the middle of noise, an old level that price has already broken, or a zone from the wrong timeframe. The level may look precise, but precision is not the same as usefulness.
One common error is treating support and resistance as exact lines. Price rarely respects a single pixel on the chart. In live markets, spreads, volatility, session changes, and liquidity sweeps can push price beyond a thin line before a reaction appears. MSNR traders usually need zones because zones reflect the area where decisions happened, not only the single price where a candle turned.
Another error is drawing every visible swing. If every high and low becomes a level, the chart becomes a maze. A trader can justify almost any entry because price is always near something. A better MSNR map uses fewer, cleaner zones: major swing highs, major swing lows, range boundaries, clear breakout retests, and areas where price moved away with conviction.
The most dangerous mistake is drawing a level without knowing what would invalidate it. If the trader cannot answer, “When is this zone no longer useful?” the line is not ready for execution. Support and resistance should help define risk. If a level cannot help define risk, it is probably just visual clutter.
Why It Matters Before Taking a Trade
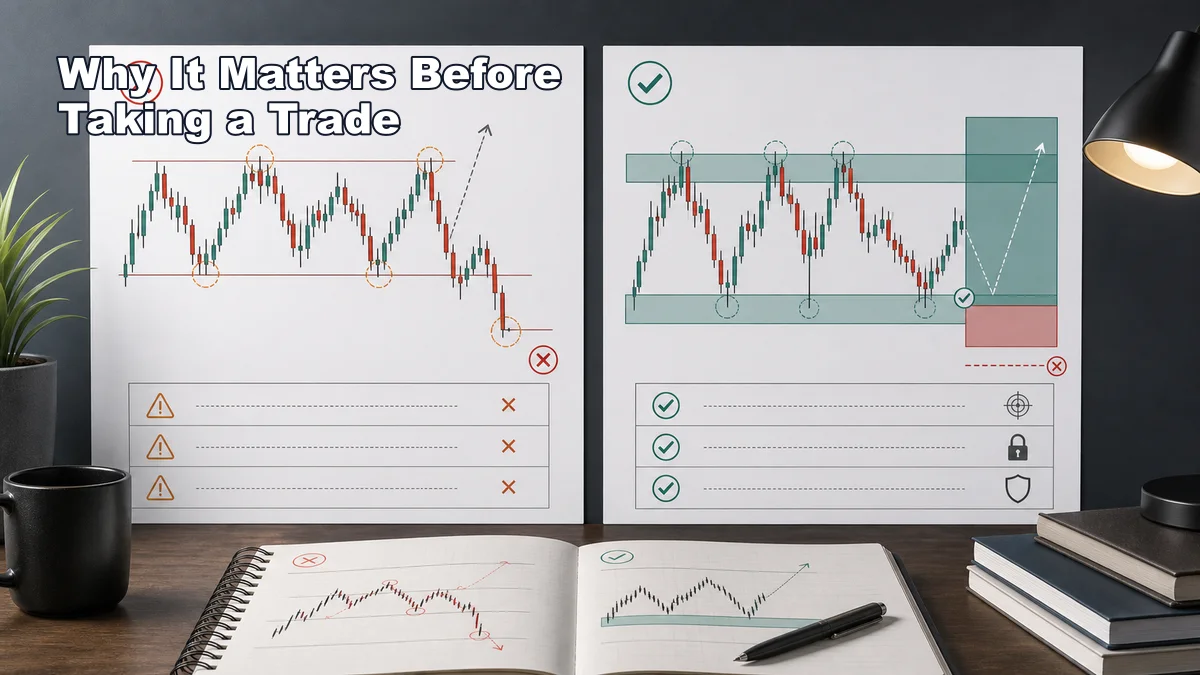
Support and resistance drawing matters before a trade because the level controls the rest of the plan. If the zone is weak, the entry becomes weak. If the zone is misplaced, the stop-loss logic becomes misplaced. If the zone is stale, the trader may be reacting to a market story that no longer exists.
Location is the first issue. A trader who buys in the middle of a range may think the entry is based on support, but the real support could be much lower. A trader who sells before price reaches resistance may be shorting a move that still has room to rise. Good drawing keeps the trade connected to an actual decision area.
Context is the second issue. A support level from a low timeframe may not matter if the higher timeframe is breaking down hard. A resistance line from an old range may not matter if price has already accepted above it. MSNR is not just level drawing. It is level drawing inside market structure.
Risk is the third issue. A useful level should make invalidation visible. For a long idea, the trader should know what kind of break below support would prove the idea wrong. For a short idea, the trader should know what kind of break above resistance would weaken or cancel the setup. Without this logic, the stop loss often becomes emotional: too tight when the trader is afraid, too wide when the trader wants to be right.
Execution quality also depends on the level. A trader who draws the zone correctly can wait for a rejection candle, breakout retest, close-based confirmation, or smaller structure shift around that area. A trader who draws the zone poorly may see confirmation everywhere and enter too often.
This is why drawing mistakes are not beginner-only problems. Intermediate traders can also make them when they force a bias, copy levels from another trader without understanding the timeframe, or keep old lines after price has invalidated them. The line on the chart is simple. The decision behind the line is where skill lives.
Worked Example with Price and Time
The following is a reconstructed teaching example, not a backtest or trade signal. On EUR/USD 15-minute data during the May 20, 2026 London session, price ranged between 1.1260 and 1.1290. At 08:45 UTC, a candle closed below the range floor at 1.1254. Price retested 1.1258 at 09:15 UTC and then closed at 1.1250.
A rule-based short plan would invalidate above 1.1268, use a 1.1270 protective stop, and target 1.1230. From a 1.1250 entry, both risk and initial target distance are 20 pips, or 1R. Spread, commission, slippage, and rollover are excluded, so this example demonstrates process only and makes no performance claim.
Step-by-Step Chart-Reading Workflow
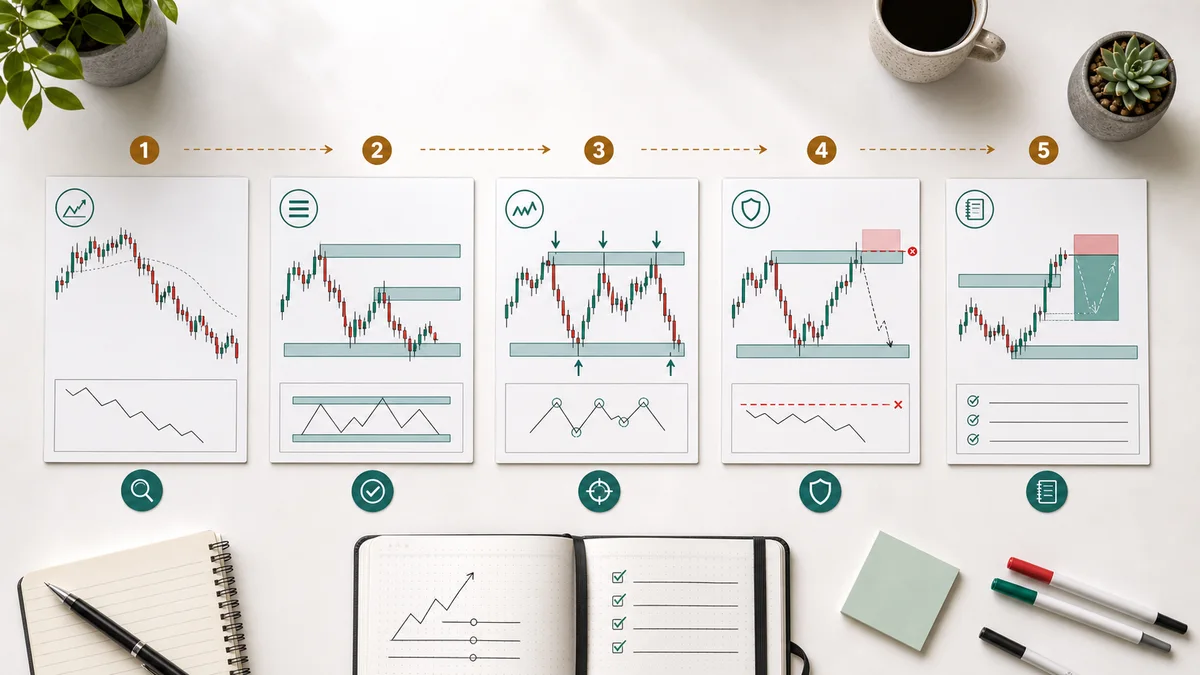
Use this workflow before placing support and resistance on an MSNR chart. The purpose is to reduce random drawing and make every zone earn its place.
- Start with the higher timeframe. Check the timeframe that controls the trade idea. If you plan to enter on a 15-minute chart, a 4-hour or daily level may matter more than a tiny intraday swing.
- Identify the current market state. Decide whether price is trending, ranging, breaking out, or chopping. A level inside a clean range behaves differently from a level inside a strong trend.
- Mark only obvious reaction areas. Look for places where price turned with strength, paused repeatedly, broke and retested, or formed a clean range boundary. If you have to zoom too far or argue with the chart, skip the level.
- Draw zones, not hairline prices. Use the candle bodies, wicks, and reaction area to estimate where the decision happened. The goal is not perfect geometry. The goal is a usable area.
- Remove weak and overlapping levels. If two levels are close, combine them into one zone or keep the cleaner one. Too many nearby lines make the chart harder to trade.
- Label the level’s job. Is it active support, active resistance, a possible flip zone, or watch-only? This prevents you from trading every mark as if it has the same quality.
- Define invalidation before entry. Decide what price behavior would make the zone no longer valid. A wick, close, retest, or structure change may all have different meanings.
- Wait for reaction. A level is a place to watch, not a signal by itself. Wait for the market to show rejection, acceptance, breakout, retest, or hesitation before building the trade plan.
A clean workflow also makes journaling easier. When a trade fails, you can review whether the zone was badly drawn, the reaction was weak, the stop was wrong, or the market condition changed. Without a workflow, every loss feels like a mystery.
Many traders improve quickly when they limit themselves to three to five active zones per chart. This does not mean only three zones exist in the market. It means only the clearest zones should influence the next trade decision. Fewer levels force better choices.
Entry, Invalidation and Stop-Loss Logic
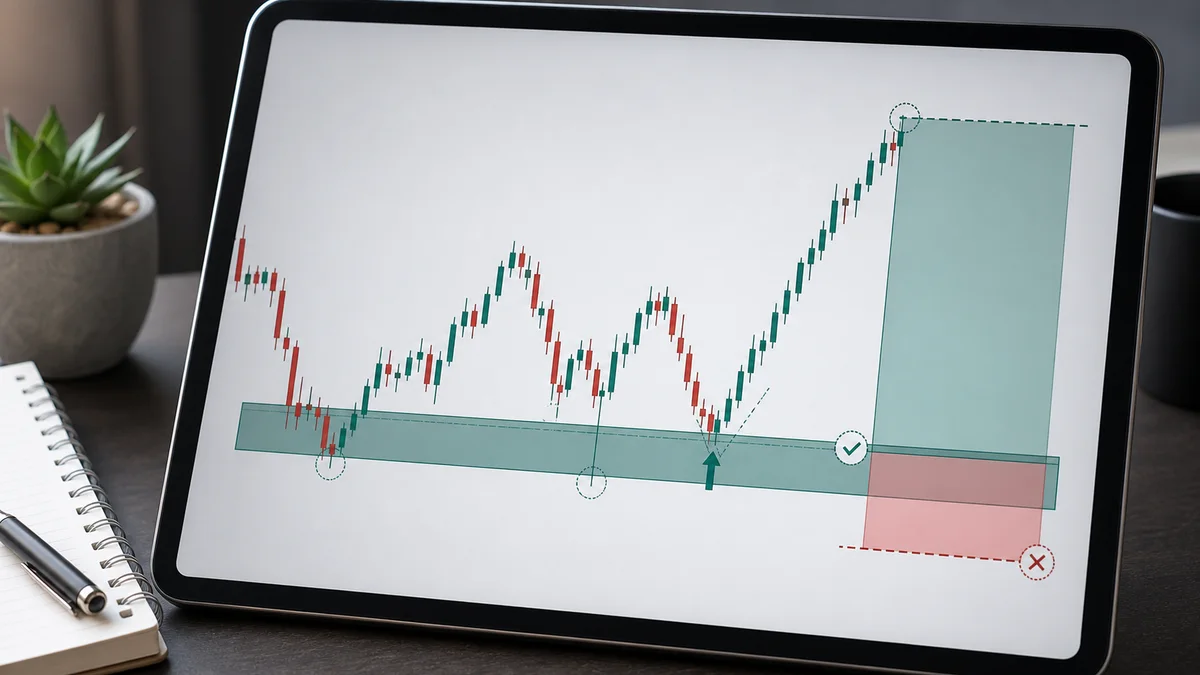
Entry, invalidation, and stop-loss logic should come from the same support or resistance story. If the zone gives the location, the reaction gives the trigger, and invalidation gives the risk boundary. These three parts should not be separated.
For a long setup, a trader might mark a higher-timeframe support zone and wait for price to return. The entry idea may require a rejection wick, a bullish engulfing candle, a close back above the zone, or a lower-timeframe structure shift. The invalidation might be a decisive break and hold below the zone, or a break below the reaction low after confirmation. The stop loss should sit where the long idea is wrong, not where the trader simply feels comfortable.
For a short setup, the logic is reversed. A trader marks resistance, waits for seller reaction, and looks for confirmation before entering. Invalidation may be a break and hold above resistance, a failed rejection, or a retest that turns resistance into support. If price has already accepted above the zone, the old short idea should be canceled or relabeled.
The mistake is using the line as the entry and ignoring the rest. A touch of support is not automatically a buy. A touch of resistance is not automatically a sell. The market can break a level, sweep liquidity, retest, or simply continue through it. The trader needs a defined reaction and a risk plan before entry.
Stop-loss placement also reveals drawing quality. If the stop has to sit randomly in the middle of a zone, the level may not be clear enough. If the stop has to be so wide that the target no longer makes sense, the trade may need to be skipped. If the stop sits so tight that normal noise can remove the trade before invalidation, the trader is not respecting the zone as an area.
A practical rule is to write one sentence before entry: “I am taking this setup because price is reacting at this zone, and the idea is wrong if this specific behavior happens.” If that sentence is vague, the drawing is not ready to become a trade.
Common Mistakes and Checklist
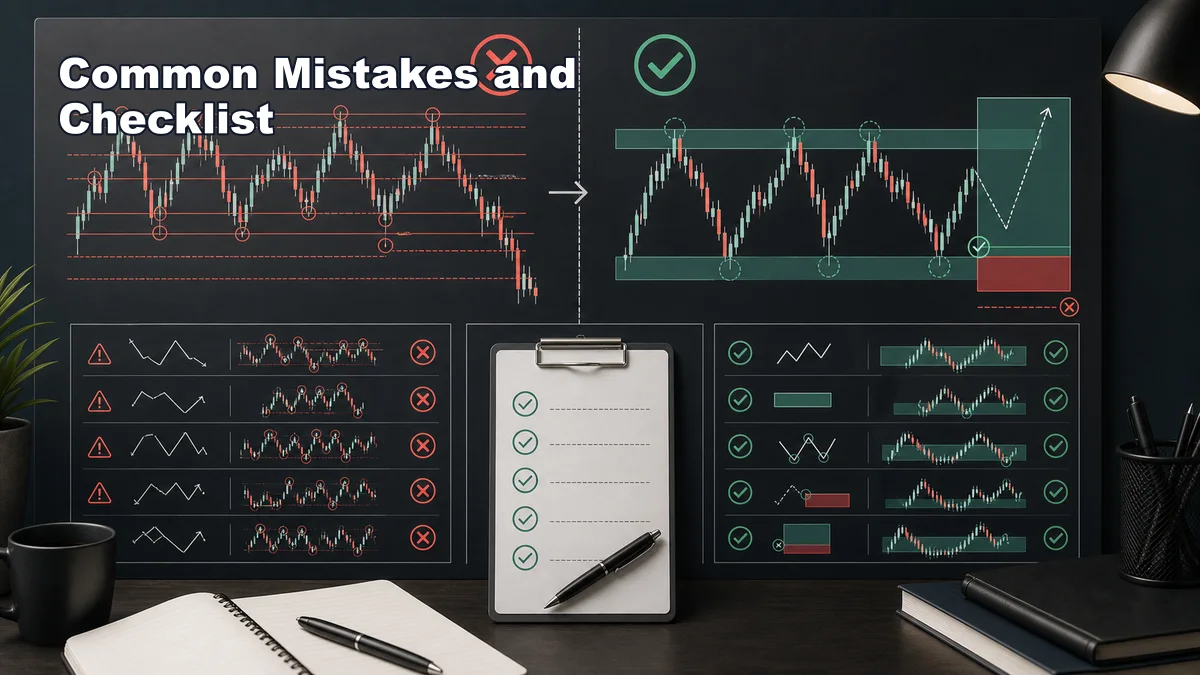
The most common MSNR mistakes come from drawing too much, drawing too late, or drawing without context. These errors often look small on the chart, but they can change the entire trade plan.
- Drawing exact lines instead of zones: a thin line can make normal volatility look like failure or confirmation.
- Marking every swing: too many levels create false confidence and overtrading.
- Ignoring the higher timeframe: a lower-timeframe support may be weak if it sits directly under major resistance.
- Keeping stale levels: old support and resistance can lose quality after breaks, repeated chop, or structure changes.
- Moving levels after entry: adjusting the zone to protect a losing idea destroys the test data.
- Forcing candle confirmation: a rejection candle in the wrong location is not enough.
- Placing stops without invalidation: the stop should match the trade thesis, not the trader’s mood.
Use this checklist before taking an MSNR trade:
- Is the level obvious without heavy zooming?
- Does it come from a major swing, range edge, or clear reaction area?
- Have I checked the higher timeframe context?
- Is the level still active, or has price already invalidated it?
- Did I draw a zone instead of a single fragile line?
- Is price actually near the zone now?
- Has price shown a tradable reaction?
- Can I define invalidation before entry?
- Does the stop-loss location make sense after spread, volatility, and normal noise?
- Is there enough room to the next opposing zone?
If the answer is unclear, the best trade may be no trade. MSNR is strongest when it keeps the trader selective. Good drawing does not guarantee profit, but it can remove many avoidable mistakes before they become live risk.
Read the Full MSNR Guide: Continue with the full MSNR trading strategy guide for the complete support-resistance framework, checklist, examples, and related lessons.
FAQ
What are the most common support resistance drawing mistakes?
The most common mistakes are drawing exact lines instead of zones, marking too many levels, ignoring the higher timeframe, keeping stale zones, and entering without a clear invalidation point.
Should MSNR traders use support and resistance lines or zones?
Zones are usually more practical than thin lines because price often reacts across an area. Lines can still help as references, but the trade plan should allow for normal volatility around the level.
How do I know if a support or resistance zone is no longer valid?
A zone may be invalid when price closes beyond it, accepts on the other side, retests it as a flip level, or chops through it so often that the original reaction is no longer clear.
Can a good support resistance level still fail?
Yes. A clean level only improves planning. It does not guarantee a bounce or rejection. Traders still need invalidation, stop-loss logic, position sizing, and review.
Connect this setup to the wider framework
Drawing errors are easier to spot when the process is compared with step-by-step MSNR levels, close and open rules, and line-versus-candlestick charts.
Once the area is fixed, label zone quality, check invalidation, and use multi-timeframe context rather than adding more rectangles.
Sources and limits
General market-risk and technical-analysis references:
Strategy labels and chart examples are interpretive; they are not standardized signals and do not guarantee outcomes.