


A clean level break can feel like the easiest trade on the chart. Price pushes through support or resistance, momentum looks strong, and the trader wants to enter before the move leaves without them. The problem is that many breaks are not real continuations. They are fakeouts, liquidity grabs, failed closes, or noisy pushes through a support and resistance zone. This is why msnr breakout fakeout validation matters.
In MSNR, a breakout is not confirmed just because price crosses a line. Traders study the level as a zone, then watch how price closes, accepts, retests, and reacts around that zone. A valid break should make the old level less useful as a barrier and often turn it into a possible retest area. A fakeout usually breaks the level briefly, traps breakout traders, then returns back inside the prior structure.
This guide is written for beginner to intermediate retail traders who already understand basic support and resistance, but struggle with execution around breaks. It explains how to separate a useful SNR breakout retest from a false breakout trading trap. For the full framework, read the main MSNR trading strategy guide.
Trading involves risk. This article is educational only and is not financial advice, investment advice, or a signal to buy or sell any market. No support or resistance break can guarantee continuation. Always define invalidation, stop loss, and position size before entering any trade.
Author and review note: Written by the HocLamTrader Editorial Team for educational chart study. Updated May 19, 2026. The examples are conceptual and should be tested with your own market, timeframe, spread, volatility, and execution rules before any real-money use.
What MSNR Breakout Fakeout Means in MSNR
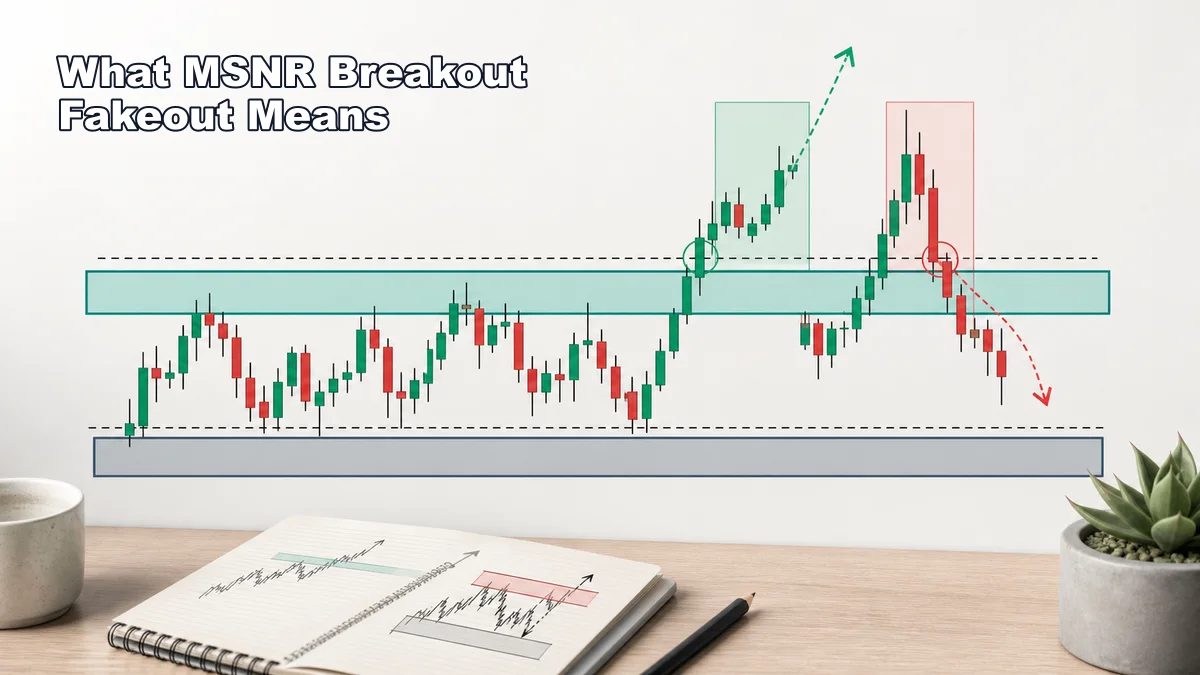
An MSNR breakout is a move through a meaningful support or resistance zone. If price breaks above resistance and holds, traders may treat the old resistance as a possible support retest. If price breaks below support and holds, traders may treat the old support as possible resistance. The key word is “possible.” The level has changed role only if current price behavior supports that idea.
A fakeout is a failed break. Price moves beyond the zone, attracts breakout traders, and then returns back through the level. Sometimes the fakeout is a single wick. Sometimes it is a candle close beyond the zone followed by immediate failure. Sometimes it is a shallow breakout that never builds acceptance and then snaps back into the range. In all cases, the original breakout idea weakens because price did not hold the new side of the level.
This is why MSNR traders usually think in zones, not exact lines. A tiny wick above resistance is not automatically a breakout. It may simply be normal volatility around the zone. A candle body closing beyond the zone is more important, but it still needs context. A strong close into the next obstacle, during low liquidity, or right before major news can still be a poor setup.
Breakout and fakeout reading also depends on structure. A bullish break above resistance inside an established uptrend may deserve more attention than the same break inside a messy range. A bearish break below support after repeated lower highs may be more meaningful than a single panic candle under a level that quickly recovers. The level is the location. The reaction tells the story.
For beginners, the practical definition is simple: an MSNR breakout is a level break that shows follow-through, acceptance, and a tradable retest or continuation plan. An MSNR fakeout is a level break that fails to hold, returns inside the prior structure, and often invalidates the breakout entry idea.
Why It Matters Before Taking a Trade

Breakout validation matters because false breaks are one of the most common support and resistance execution mistakes. A trader sees price cross resistance, enters long, and places the stop randomly because the move feels urgent. Then price falls back below the level. The problem was not only the losing trade. The bigger problem was entering before the trader knew what would prove the breakout wrong.
MSNR slows that decision down. Instead of asking, “Did price touch the other side of the line?” the trader asks better questions. Did price break a real zone or only a thin drawing? Did it close beyond the area with strength? Did it return for a controlled SNR breakout retest? Did the retest show buyers defending old resistance as support, or sellers defending old support as resistance? Is there enough room before the next higher-timeframe obstacle?
This matters even more for beginners because breakouts create emotional pressure. A market can move quickly during a break, and quick movement can make a trader feel that waiting is dangerous. In reality, waiting for validation can be the safer decision. Missing one move is less harmful than building a habit of chasing every candle through a line.
Breakout validation also improves stop-loss logic. If your long idea depends on resistance becoming support, then a clean move back below the retest area may invalidate the trade. If your short idea depends on support becoming resistance, then a clean reclaim above that level may invalidate it. This gives the stop a reason. It is not a random number or a fixed distance chosen after entry.
Finally, breakout and fakeout reading helps a trader accept no-trade outcomes. Some breaks are too extended. Some retests are too deep. Some fakeouts are only obvious after the fact. MSNR does not remove uncertainty. It gives you a decision process for dealing with uncertainty before money is at risk.
Step-by-Step Chart-Reading Workflow

Use the same workflow every time you study an MSNR breakout fakeout setup. A simple routine reduces impulse decisions and makes review easier.
Step 1: Start With the Higher Timeframe
Before judging a breakout on your entry chart, check the higher timeframe. If you trade from a 15-minute chart, look at the 1-hour or 4-hour chart. If you trade from a 1-hour chart, look at the 4-hour or daily chart. You are trying to see whether the break is happening into a major obstacle, away from a clean structure, or in the middle of messy movement.
A lower-timeframe break above resistance may look strong until you notice daily resistance sitting directly above it. A short breakout below support may look clean until you notice price is already extended into weekly support. Higher-timeframe context does not predict the future, but it helps you avoid validating a break in a poor location.
Step 2: Mark the Real Zone
Draw the support or resistance area as a zone. Include the most relevant candle bodies, wicks, swing points, and repeated reactions. Avoid drawing a single thin line and treating every tiny pierce as a decisive break. A fakeout often happens because the trader makes the level too exact.
The best zones are obvious. They usually come from a range high, range low, prior swing high, prior swing low, or an old level where price reacted strongly. If the level is not obvious, the breakout is harder to trust.
Step 3: Watch the Break Quality
A valid break often shows energy through the zone and closes beyond it. A weak break may show a long wick, hesitation, or immediate rejection. Candle close matters, but it is not the only clue. Look at the approach into the level, the size of the break, the volume of candles if you use volume, and whether price has room to continue.
Do not treat every large candle as proof. A large candle can also be exhaustion, especially if it breaks a level after a long move and closes into a nearby opposing zone.
Step 4: Wait for Acceptance or Retest
Acceptance means price spends time beyond the broken zone instead of instantly returning. Retest means price comes back to the old level and shows whether the role has changed. For a bullish breakout, old resistance may become support. For a bearish breakout, old support may become resistance.
The retest does not need to be perfect. Price may retest the zone, sweep slightly through it, or form a small structure shift around it. What matters is whether the reaction supports the breakout idea. If price breaks above resistance, retests, and then fails back below the zone with strength, the breakout idea is likely damaged.
Step 5: Define the Trade Plan Before Entry
Before entering, write the idea in one sentence. For example: “I am considering a long because price broke above a clean resistance zone, accepted above it, and the retest is holding as support.” Then write invalidation: “This idea is wrong if price reclaims the old range and closes back below the retest area.” If you cannot write both sentences, the setup is not ready.
Step 6: Review the Outcome
After the setup plays out, save a screenshot. Mark what you saw before entry, where the retest occurred, where the idea was invalidated, and whether you followed the plan. Reviewing both valid breakouts and fakeouts is how traders learn the difference between live evidence and hindsight certainty.
Entry, Invalidation and Stop-Loss Logic
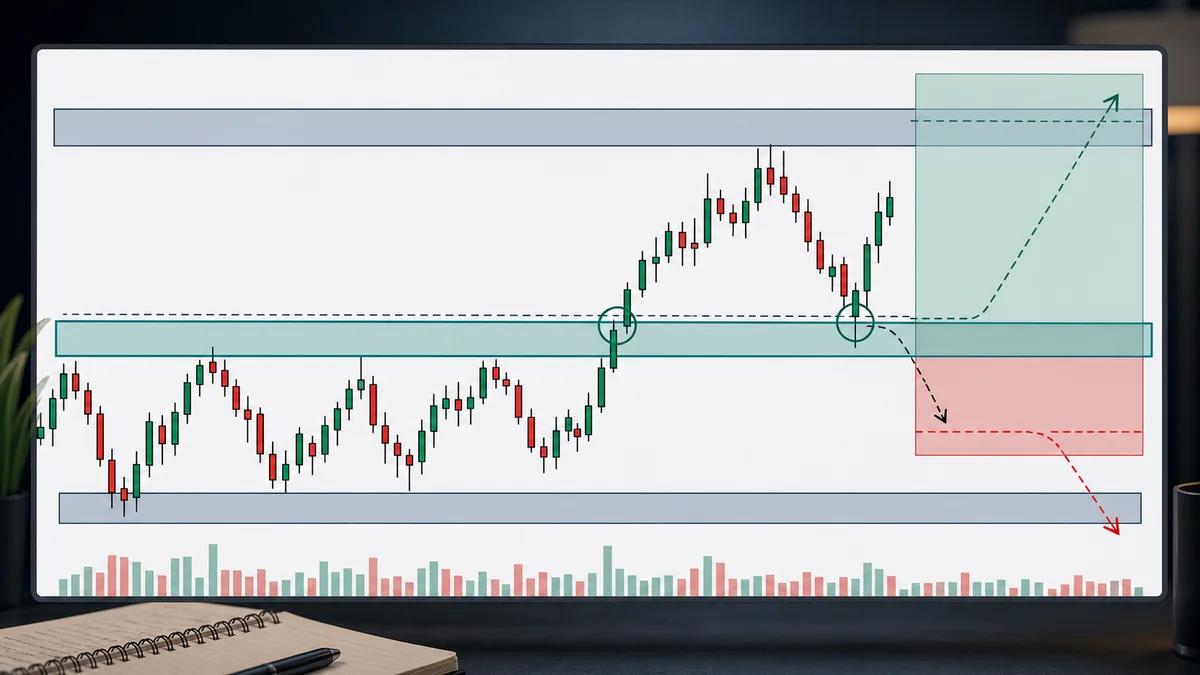
There are three common ways traders approach an MSNR breakout. The first is the aggressive close entry, where the trader enters after a strong candle closes beyond the zone. This can catch momentum, but it also carries higher fakeout risk because there may be no retest. Beginners should be careful with this style.
The second is the breakout retest entry. Price breaks the zone, returns to it, and shows a reaction in the direction of the break. This is often cleaner for beginners because the invalidation point is easier to define. If old resistance is supposed to become support, then a strong failure back below that support damages the long idea. If old support is supposed to become resistance, then a strong reclaim above that resistance damages the short idea.
The third is the failed-break entry. This is a fakeout trade, not a breakout trade. For example, price breaks above resistance, fails to hold, and returns back under the level. A trader may then look for a short only if the context, structure, and risk make sense. The danger is reacting too fast. Not every failed break becomes a high-quality reversal.
Invalidation should be based on the logic of the setup. For a bullish breakout retest, invalidation may sit below the retest zone, below the reaction low, or below the structure that proves buyers are no longer defending the area. For a bearish breakout retest, invalidation may sit above the retest zone, above the reaction high, or above the structure that proves sellers failed to defend.
Stop loss should be placed around invalidation with enough room for normal volatility. A stop placed inside the retest zone may be too tight if your idea depends on the zone holding as an area. A stop placed too far away may make the risk-to-reward unattractive. If the correct stop does not fit your risk plan, reduce position size or skip the setup.
Targets should be based on the next logical area, not emotion. A long breakout may target the next resistance zone, prior swing high, or measured range area. A short breakout may target the next support zone, prior swing low, or range expansion area. If the next obstacle is too close, the breakout may not offer enough room after fees, spread, and volatility.
The safest beginner rule is this: do not enter a breakout or fakeout setup until you know the exact condition that invalidates the idea.
Common Mistakes and Checklist
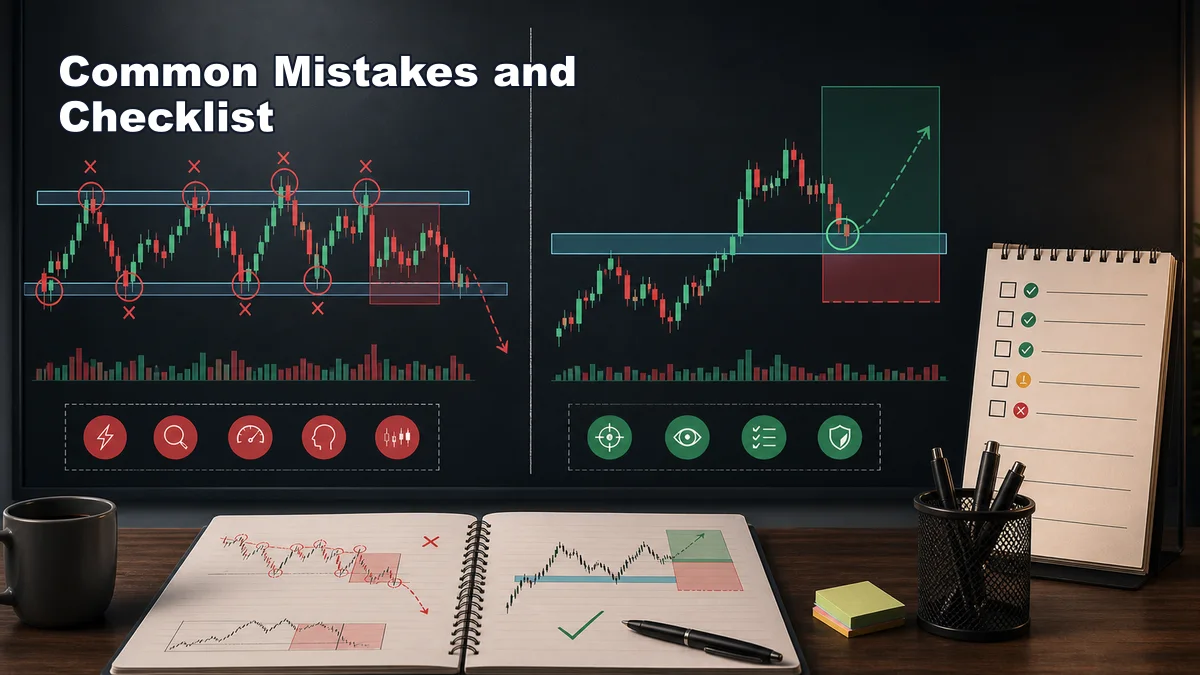
The first mistake is treating a wick as a confirmed breakout. A wick through support or resistance may show a liquidity sweep, not continuation. Wait for the candle close, the reaction after the close, and the broader context.
The second mistake is ignoring the zone width. If you draw an exact line through a messy area, every small movement looks like a break. Draw the zone first, then judge whether price has truly moved beyond the area.
The third mistake is chasing the first candle. A strong breakout candle can be useful, but entering after the move has already traveled far may create poor stop placement and weak targets. Waiting for a retest often gives cleaner risk, even if it means missing some trades.
The fourth mistake is assuming every retest must hold perfectly. A level can retest with wicks, small sweeps, or short-term noise. The question is not whether price touched the zone perfectly. The question is whether the reaction still supports the breakout idea.
The fifth mistake is trading fakeouts as revenge. After being trapped by a false breakout, a trader may flip direction immediately. That can create another emotional entry. A failed break can become a setup only if the context, trigger, invalidation, and risk all align.
Use this MSNR breakout fakeout checklist before entering:
- Is the support or resistance zone obvious on the chart?
- Have I checked the higher timeframe for nearby obstacles?
- Did price break the zone, or only pierce a thin line?
- Did price close beyond the zone with useful structure?
- Has price shown acceptance, retest behavior, or clear failure?
- Do I know whether I am trading continuation or a failed break?
- Is invalidation defined before entry?
- Does the stop loss sit beyond invalidation, not inside normal noise?
- Is there enough room to the next support or resistance target?
- Will I journal the setup whether it works or fails?
Breakout trading becomes more reliable only when it becomes more selective. MSNR traders are not trying to trade every break. They are trying to validate the breaks that fit context, retest logic, and risk. That is how a support resistance fakeout becomes a lesson instead of a repeated execution mistake.
Read the Full MSNR Guide: Continue with the full MSNR trading strategy guide for the complete framework, checklist, examples, and related MSNR subtopics.
Frequently Asked Questions
What is an MSNR breakout fakeout?
An MSNR breakout fakeout is a support or resistance break that fails to hold. Price moves beyond the zone, attracts breakout traders, then returns back into the prior structure and weakens the original breakout idea.
How do MSNR traders validate a breakout?
They check the quality of the zone, higher-timeframe context, candle close, acceptance beyond the level, retest behavior, invalidation, stop-loss logic, and room to the next target. A line cross by itself is not enough.
Is a fakeout always a reversal signal?
No. A fakeout can lead to reversal, range continuation, or more noise. It becomes tradable only when the reaction, structure, and risk create a clear plan.
Connect this setup to the wider framework
A level break should be read inside the broader market-structure framework and the rules for MSNR role reversal. The state of fresh and tested zones changes how much weight a retest deserves.
If the break fails, compare the close with the liquidity-sweep process. If it holds, review resistance-zone validation and the top-down workflow before selecting an entry chart.
Sources and limits
General market-risk and technical-analysis references:
Strategy labels and chart examples are interpretive; they are not standardized signals and do not guarantee outcomes.