


The best timeframe for MSNR levels is not one magic chart. MSNR works best when each timeframe has a job. A higher timeframe helps you map the major support and resistance zones. A middle timeframe helps you refine the structure. A lower timeframe helps you read the reaction and plan entry. When those jobs are mixed together, beginners often draw too many lines, chase noisy candles, or enter trades against the level that actually controls the market.
This guide explains how to separate higher-timeframe mapping from lower-timeframe execution. It is written for beginner to intermediate retail traders who want a practical multi-timeframe SNR workflow without turning the chart into a crowded screen. The goal is not to find a perfect timeframe. The goal is to create a repeatable process for level quality, context, entry, invalidation, and review.
For the complete method, read the full MSNR trading strategy guide. You can also connect this topic with what MSNR trading means and the broader multi-timeframe analysis guide.
Trading involves risk. This article is educational only and is not financial advice, investment advice, or a signal to buy or sell any market. Timeframe choice does not remove uncertainty. Always test your rules, define invalidation, use stop loss, and size positions responsibly.
Author and review note: Written by the HocLamTrader Editorial Team for educational chart study. Updated May 19, 2026. Examples are conceptual and should be forward tested with your own market, spread, session, volatility, and execution conditions.
What Best Timeframe for MSNR Levels Means in MSNR
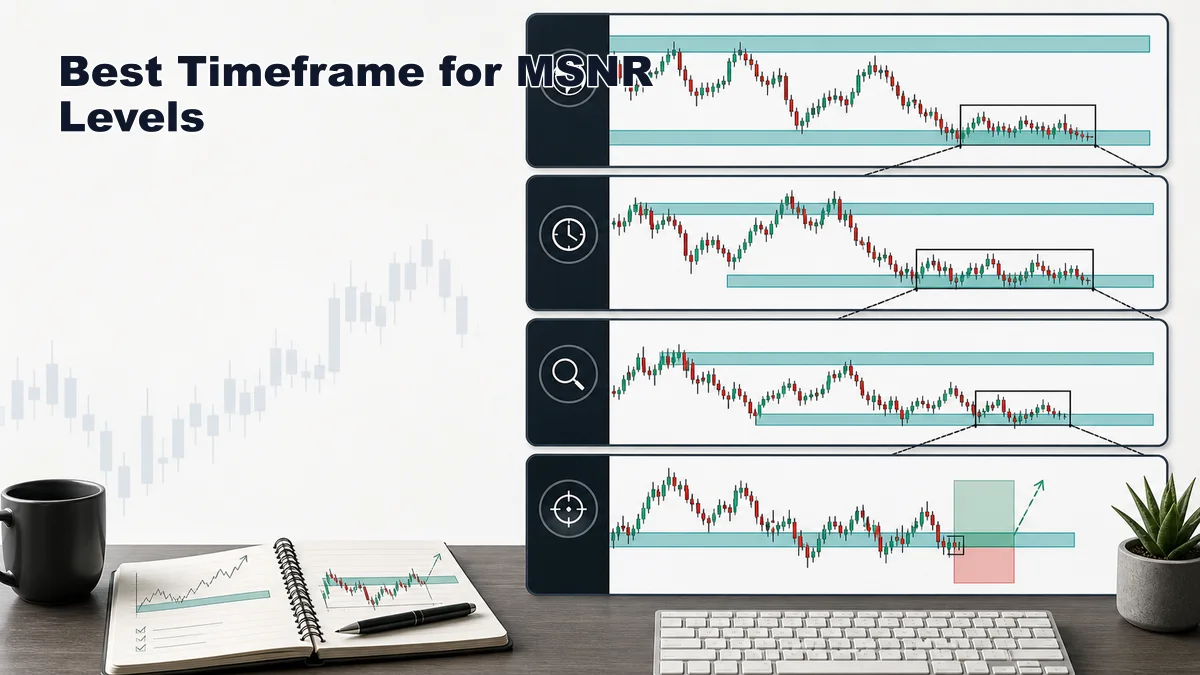
In MSNR, timeframes are not all used for the same purpose. A weekly or daily chart may define major support and resistance that many traders can see. A 4-hour or 1-hour chart may refine those areas into cleaner decision zones. A 15-minute or 5-minute chart may show the reaction, retest, or structure shift that creates an entry plan.
The phrase “best timeframe” can mislead beginners because it sounds like one chart should solve everything. In practice, a single timeframe often creates blind spots. If you only use a lower timeframe, you may draw levels that are too small and ignore the higher-timeframe zone above or below price. If you only use a higher timeframe, your zones may be too wide for precise entry and stop placement.
A better question is: what timeframe should control the level, and what timeframe should control execution? For many MSNR learners, the higher timeframe controls the map. The lower timeframe controls the trigger. This keeps the trader from entering on a tiny support level while price is pushing directly into a larger resistance zone.
A simple swing-trading stack might use daily for context, 4-hour for levels, and 1-hour for execution. A day-trading stack might use 4-hour for context, 1-hour for levels, and 15-minute for execution. A very short-term trader might use 1-hour for context, 15-minute for levels, and 5-minute for entry. These are not rules for everyone. They are examples of separating roles.
The best timeframe for MSNR levels is the one that gives you levels large enough to matter, clean enough to draw, and close enough to your execution chart that risk can be planned. If a timeframe creates clutter or forces entries outside your schedule and risk tolerance, it is not the best timeframe for you.
Why It Matters Before Taking a Trade
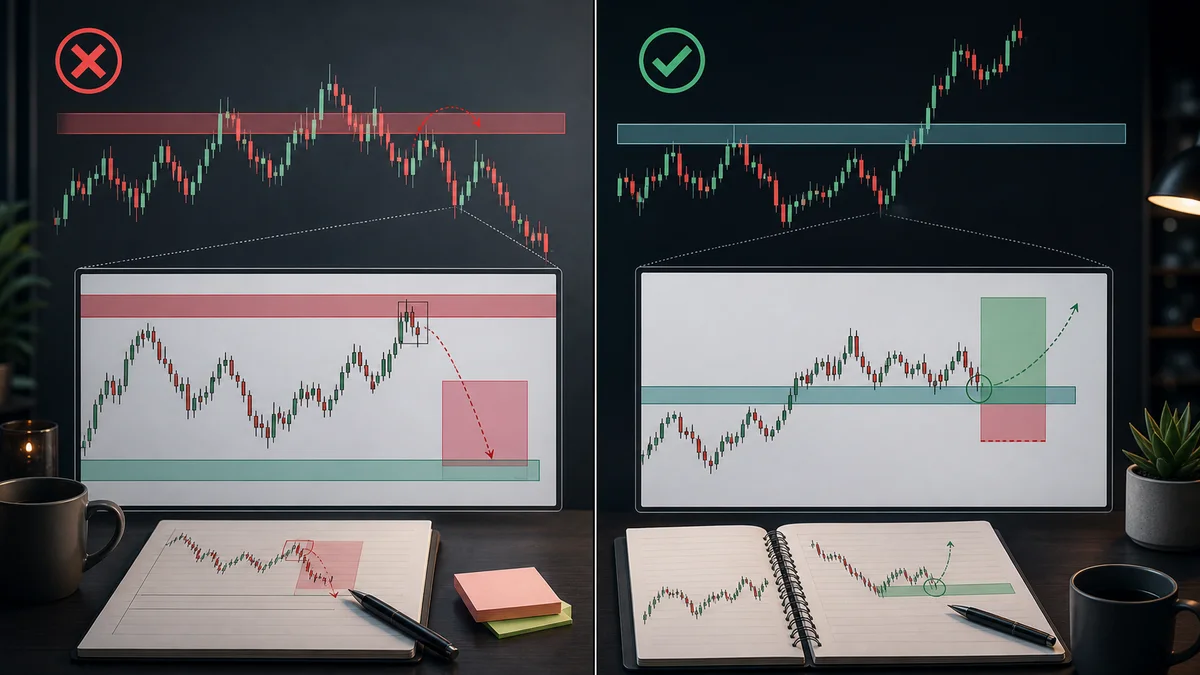
Timeframe selection matters because many trades fail before the entry because the trader is watching the wrong chart. A 15-minute support bounce may look clean, but if it is happening directly under a 4-hour resistance zone, the long idea has limited room. A 5-minute breakout may look exciting, but if daily support is just below the short entry, the trade may be chasing into a larger reaction area.
MSNR is built around support and resistance zones. Larger zones often influence smaller charts. This does not mean the higher timeframe always wins. It means a trader should know where the larger decision areas are before trusting a smaller signal. Multi-timeframe SNR helps you avoid treating local noise as a complete trade idea.
The second reason it matters is stop-loss logic. If you map a zone on the 4-hour chart but enter from the 5-minute chart, the correct invalidation may not be the same size as a tiny 5-minute candle. A lower-timeframe entry can improve precision, but it should not hide the risk implied by the higher-timeframe level.
The third reason is trade management. A trader using daily levels may need wider stops, longer holding periods, and more patience. A trader using 15-minute levels may need faster decisions, tighter execution rules, and more awareness of spread and session volatility. The timeframe should match the way you can actually trade, not only the chart that looks best after the move is finished.
The fourth reason is review quality. If every trade uses a different random timeframe stack, it becomes hard to know what is improving or failing. A consistent MSNR timeframe plan lets you compare similar setups. You can see whether your 4-hour levels are useful, whether your 15-minute triggers are too early, or whether your stops are being placed inside normal noise.
Step-by-Step Chart-Reading Workflow
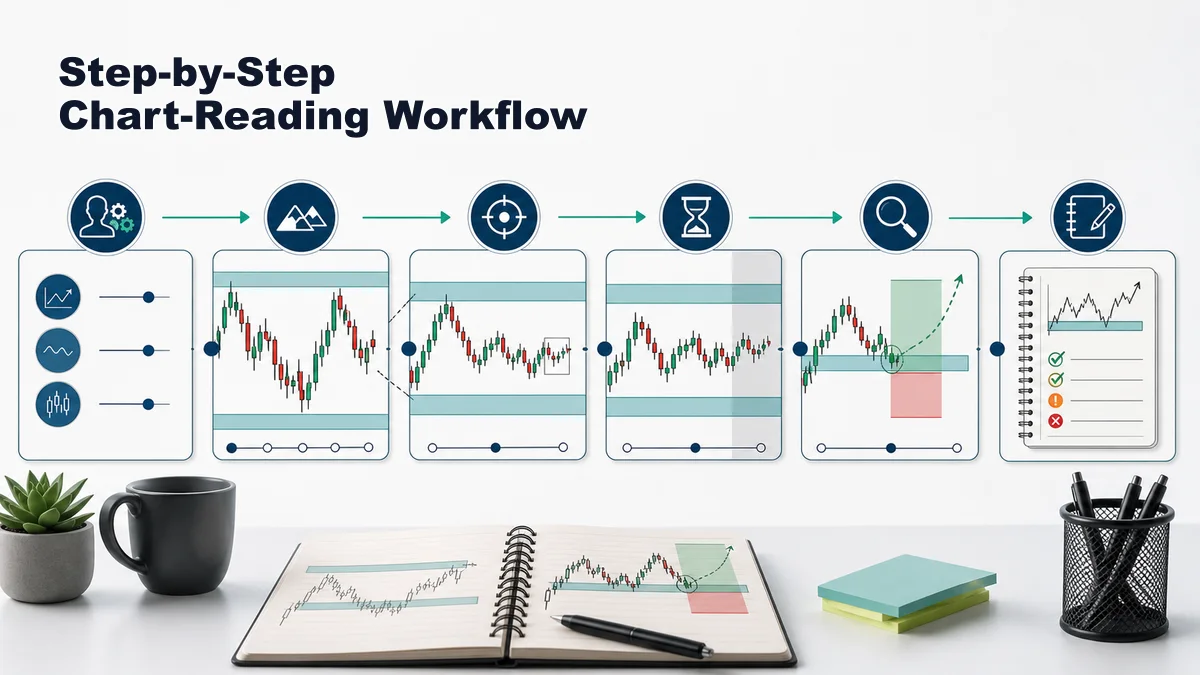
Use this workflow when drawing MSNR levels across timeframes. The exact chart choices can change, but the order should stay consistent.
Step 1: Choose Your Trading Style First
Before opening the chart, decide what kind of trader you are for this setup. A swing trader, day trader, and scalper should not use the same timeframe stack. Your holding period, schedule, account risk, and emotional tolerance all matter. If you can only check charts twice a day, a 5-minute execution plan may create more stress than skill.
A simple rule is to choose one context timeframe, one level timeframe, and one execution timeframe. More than three can become confusing for beginners.
Step 2: Map the Higher-Timeframe Context
Start with the broad chart. Mark only the major support and resistance zones that could affect the next trade idea. Look for large swing highs, large swing lows, range boundaries, old breakout areas, and levels where price reacted strongly. Do not mark every candle. The higher timeframe should simplify the map, not overload it.
At this stage, ask whether price is trending, ranging, approaching a major zone, or moving in the middle of space. If price is already inside a major higher-timeframe zone, lower-timeframe signals need extra caution.
Step 3: Refine the Level on the Middle Timeframe
Move one step lower. Use the middle timeframe to refine the higher-timeframe zone into a cleaner decision area. You may see which part of the zone had the strongest reaction, where candle bodies clustered, or where the last breakout began. This helps avoid drawing a huge zone that is too wide for practical execution.
The goal is refinement, not replacement. If the lower chart disagrees with the higher chart, do not delete the higher-timeframe context just because the smaller chart looks cleaner.
Step 4: Wait for Price to Reach the Zone
Many beginners draw levels correctly and still enter too early. The setup matters only when price approaches the area. If price is far from the zone, there is no MSNR trade yet. Waiting keeps your decision connected to support and resistance instead of random candle movement.
Step 5: Read the Lower-Timeframe Reaction
When price reaches the mapped zone, drop to the execution chart and study the reaction. Does price reject? Does it break and retest? Does it sweep the zone and return? Does it form a small structure shift? Lower-timeframe details can help with timing, but they should support the larger map.
For example, if the 4-hour chart shows resistance and the 15-minute chart forms a failed breakout above that resistance, the lower-timeframe reaction may support a short idea. If the 15-minute chart breaks resistance cleanly and retests it as support, the larger resistance may be weakening. Context and reaction must be read together.
Step 6: Build the Plan and Review It
Before entry, write the context timeframe, level timeframe, execution timeframe, entry trigger, invalidation, stop loss, and target. After the trade, review whether the chosen stack helped or hurt the decision. Over time, this tells you which timeframe combinations fit your market and personality.
Entry, Invalidation and Stop-Loss Logic
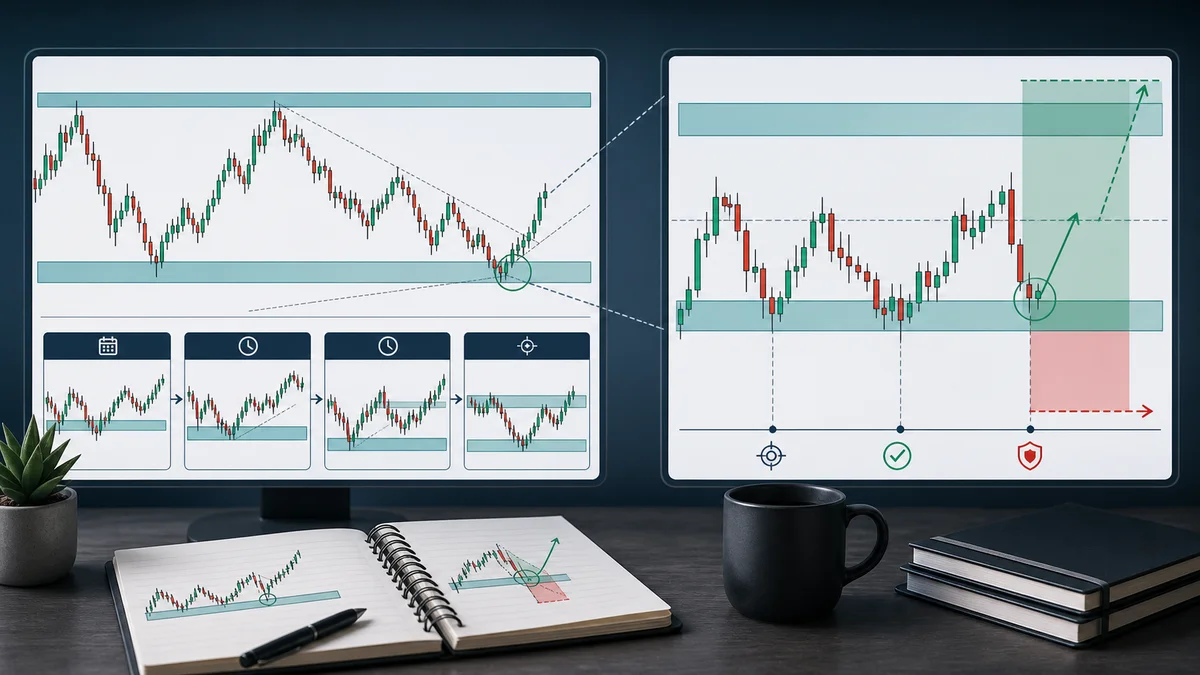
Timeframe choice changes entry and stop-loss logic. If the higher timeframe creates the trade location, then invalidation should respect that location. If the lower timeframe creates the entry trigger, then the trigger can help tighten execution. The mistake is using the lower timeframe to make risk look smaller while ignoring the higher-timeframe zone.
Consider a bullish example. The 4-hour chart shows price pulling into a support zone. The 15-minute chart shows a sweep below the zone, recovery, and small structure shift. A trader may use the 15-minute chart for entry, but the long idea still depends on the 4-hour support area holding. If the stop is placed too tightly inside the normal 4-hour zone, the trade may be stopped by noise even if the broader idea remains valid.
Consider a bearish example. The daily chart shows resistance. The 1-hour chart refines the resistance into a smaller supply area. The 15-minute chart shows a failed breakout and lower high. A short entry may be planned from the 15-minute trigger, but invalidation may need to be above the refined resistance or above the reaction high, not randomly above the entry candle.
This is where position sizing matters. A higher-timeframe level may require a wider stop. A wider stop does not mean you must risk more money. It means your position size should be smaller if you keep the same account risk. If the stop required by the level is too wide for your plan, skip the trade or wait for a better lower-timeframe structure that provides a logical, tighter invalidation.
Targets should also match the timeframe. A trade based on a 4-hour support bounce may target the next 4-hour resistance, not only the next 5-minute swing. A trade based on a 15-minute range may need a smaller target. Mixing target timeframe and entry timeframe without a plan can make a good setup look bad or a weak setup look better than it is.
A clean MSNR timeframe plan should answer four questions before entry:
- Which timeframe gives the main context?
- Which timeframe defines the level?
- Which timeframe gives the trigger?
- Which level or structure invalidates the trade idea?
If those answers are unclear, the trade is not ready.
Common Mistakes and Checklist
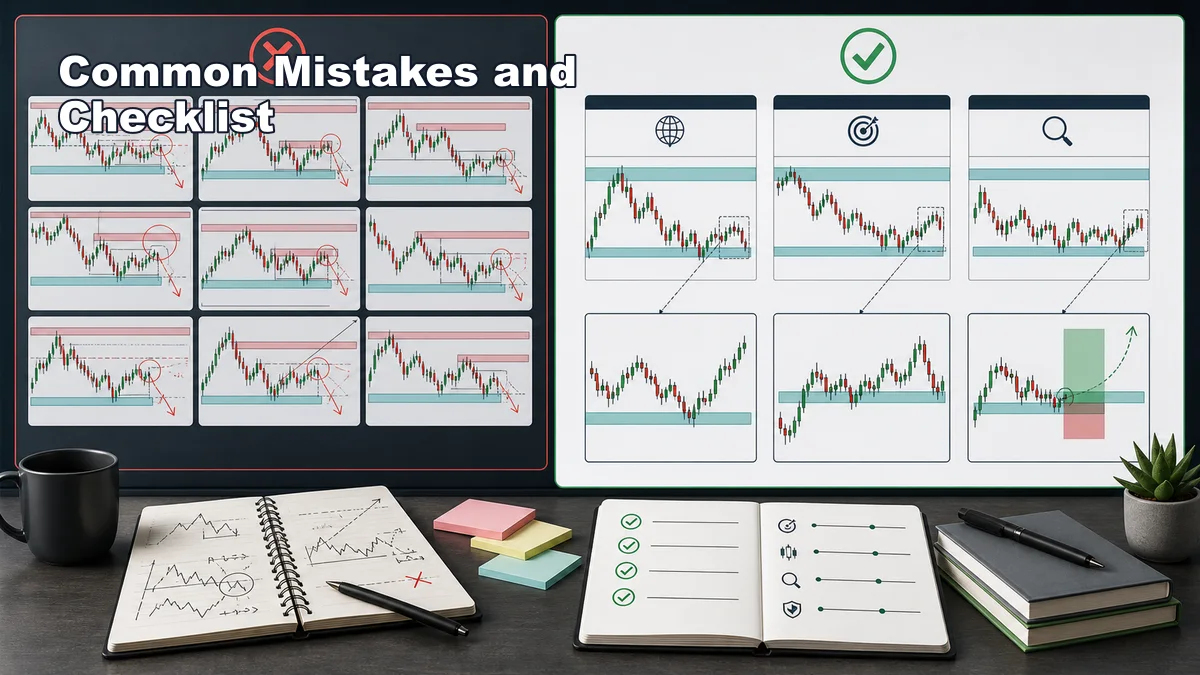
The first mistake is drawing every level from every timeframe. This creates a chart where price is always near something. Beginners should start with the cleanest higher-timeframe levels, then refine only the zones that matter to current price.
The second mistake is using the lower timeframe as the boss. A 5-minute pattern can look attractive, but it should not override a daily or 4-hour level without strong evidence. Lower-timeframe charts are useful for timing. They are not always useful for context.
The third mistake is switching timeframes after the trade goes wrong. If a trader enters from the 15-minute chart and then moves to the 4-hour chart only to justify holding a losing position, the timeframe plan has become emotional. Choose the stack before entry and respect the invalidation rule.
The fourth mistake is using a stop loss from one timeframe and a target from another without logic. For example, using a 5-minute stop and expecting a daily target may create a trade that is too fragile. Using a daily stop for a 5-minute scalp may create poor risk-to-reward. The timeframe behind the idea should match the risk plan.
The fifth mistake is believing one timeframe is always best. The best timeframe for msnr levels depends on the instrument, volatility, session, spread, and your trading style. Forex, crypto, indices, and stocks can behave differently. Even the same market can shift between quiet and volatile conditions.
Use this checklist before drawing MSNR levels:
- Have I chosen my trading style for this setup?
- Do I have one context timeframe, one level timeframe, and one execution timeframe?
- Are the higher-timeframe zones obvious and uncluttered?
- Have I refined the zone without deleting the broader context?
- Is price near the zone now, or am I forcing a trade in the middle?
- Does the lower-timeframe reaction support the higher-timeframe idea?
- Is invalidation based on the level that created the trade idea?
- Does the stop loss fit the timeframe and normal volatility?
- Is the target based on the next logical zone for this trade type?
- Will I review whether this timeframe stack helped the decision?
The practical rule is simple: map from higher timeframe to lower timeframe, but execute only when the lower-timeframe reaction agrees with the bigger plan. That is how MSNR traders separate HTF mapping from LTF execution without turning the chart into noise.
Read the Full MSNR Guide: Continue with the full MSNR trading strategy guide for the complete framework, risk checklist, examples, and related MSNR subtopics.
Frequently Asked Questions
What is the best timeframe for MSNR levels?
The best timeframe depends on your trading style. A common approach is to use a higher timeframe for context, a middle timeframe for level refinement, and a lower timeframe for execution.
Should beginners draw MSNR levels on the 15-minute chart?
Beginners can use the 15-minute chart for execution, but they should usually check a higher timeframe first. Drawing only 15-minute levels can make the chart too noisy and ignore larger support or resistance zones.
Can I use daily levels with intraday MSNR entries?
Yes, but risk must be planned carefully. Daily levels can create important context, while intraday charts may help with timing. Invalidation and position size should still respect the level that created the trade idea.
Connect this setup to the wider framework
Timeframe selection works best when each chart has one job. Use multi-timeframe analysis for context, then apply the drawing rules from how to draw MSNR levels and the comparison of line and candlestick charts.
After the zone is marked, classify fresh and tested levels, define zone invalidation, and use candle confirmation only on the designated trigger timeframe.
Sources and limits
General market-risk and technical-analysis references:
Strategy labels and chart examples are interpretive; they are not standardized signals and do not guarantee outcomes.