


Liquidity sweep trading studies what happens after price trades beyond a predefined high or low where orders may cluster. The move can reject back through the level, accept outside it or continue without reversal. A chart can show the sequence, but it cannot prove that a specific participant deliberately hunted stops. A testable sweep setup therefore defines the level before price arrives, distinguishes wick and close behavior, waits for confirmation and records the price that invalidates the scenario. This guide explains identification, rejection versus acceptance, continuation alternatives, execution risk and common labelling errors.
Definition: What Is a Liquidity Sweep?
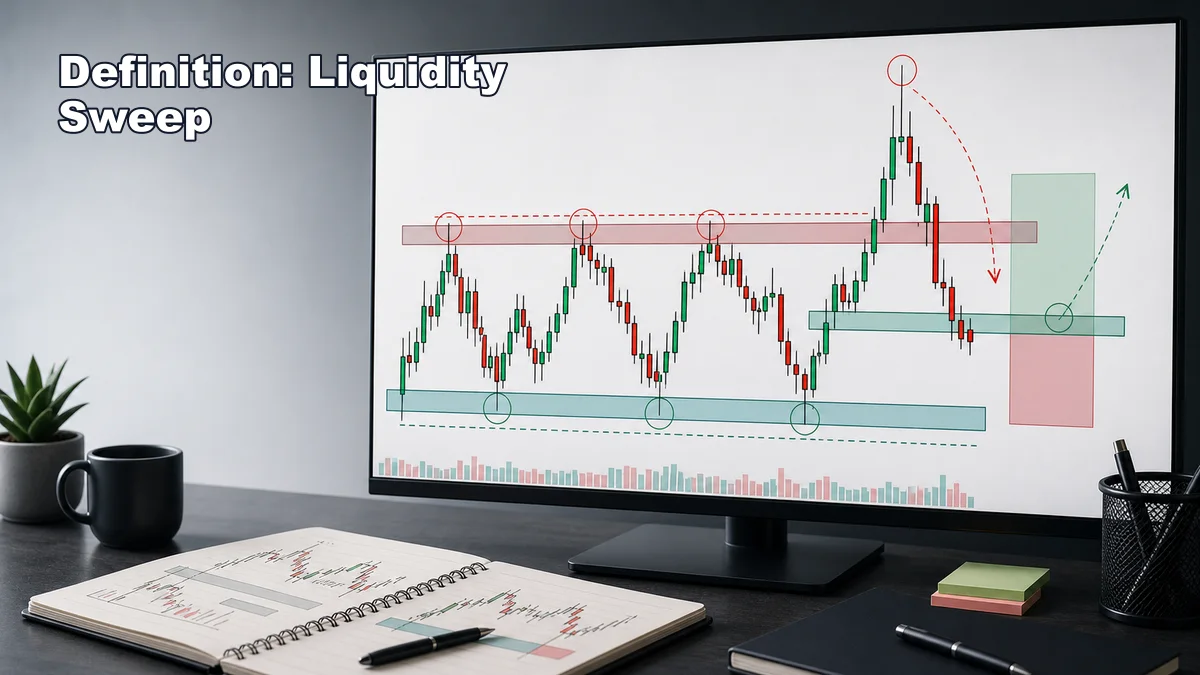
A liquidity sweep happens when price pushes beyond an obvious liquidity pool, such as a previous high, previous low, equal highs, equal lows, session high, session low, or range boundary, and then fails to stay beyond that level. A bearish sweep may move above an old high, trigger buy stops or breakout buys, then reject lower. A bullish sweep may move below an old low, trigger sell stops or breakdown sells, then reclaim the level.
The sweep itself is not an entry. It is an event. It tells the trader that price interacted with an area where orders may have been resting. The trade idea begins only after the reaction. Does price reject strongly? Does it reclaim the old range? Does it create displacement away from the sweep? Does it break short-term structure? Those questions decide whether the sweep is useful.
Beginners should also separate a normal wick from a meaningful sweep. A small wick through a tiny level in the middle of chop may not matter. A sweep of a clear higher-timeframe high, followed by strong rejection and structure shift, has more educational value. The best sweeps usually happen at obvious levels that many traders can see without forcing the chart.
How to Identify a Liquidity Sweep
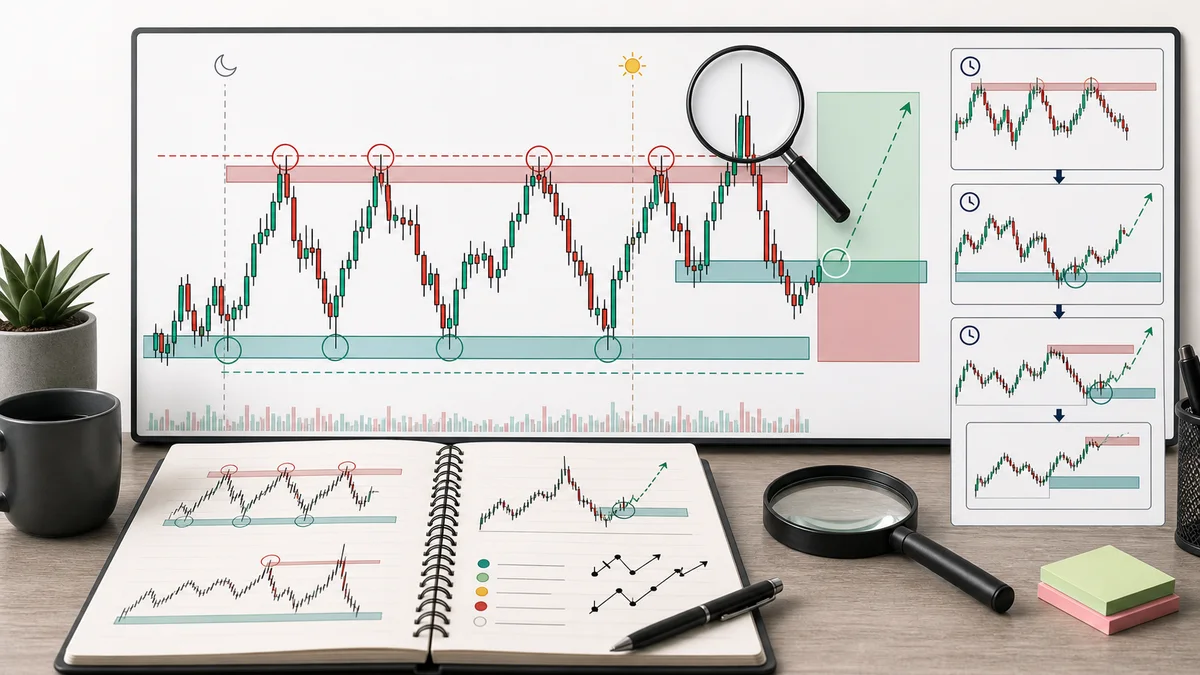
Start with the higher timeframe. Mark the highs and lows that are obvious enough to attract decisions. These may include the previous day high, previous day low, weekly high, weekly low, range high, range low, equal highs, equal lows, or a major swing point. Avoid marking every candle because too many levels make every move look like a sweep.
Next, wait for price to interact with the level. A potential sweep usually has three parts: price moves beyond the level, fails to build acceptance there, and returns back through the area. The return is important. A break above a high that consolidates above the level may be acceptance, not a stop hunt. A break below a low that keeps falling may be continuation, not a bullish sweep.
Then study the reaction after the sweep. A stronger bearish sweep often rejects above buy-side liquidity, closes back below the level, and breaks a lower-timeframe support point. A stronger bullish sweep often rejects below sell-side liquidity, reclaims the old low, and breaks a lower-timeframe resistance point. The more clearly price shifts away from the sweep, the easier it is to define risk.
Finally, check context. A liquidity sweep near a higher-timeframe support or resistance zone matters more than a random wick in the middle of a range. A sweep during an active session may be cleaner than one during thin market conditions. A sweep right before major news may be too risky to trade because spreads and volatility can expand quickly.
Why Liquidity Sweeps Work
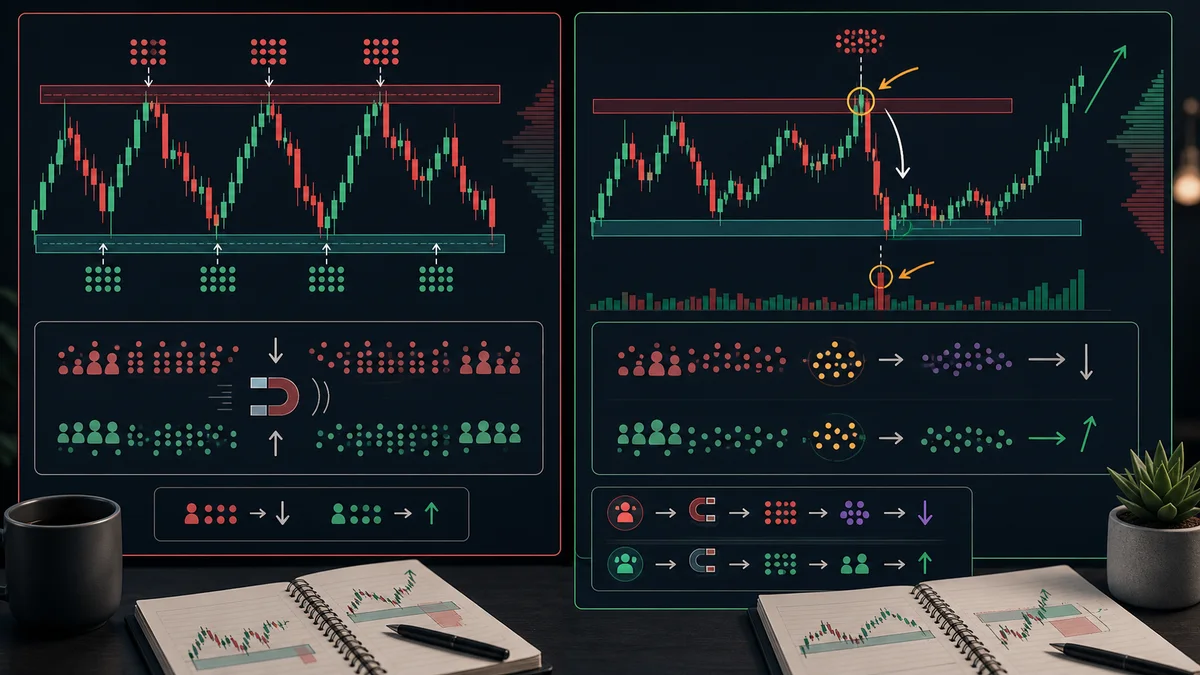
Liquidity sweeps work as a trading model because many traders use similar reference points. Short sellers may place stops above a previous high. Long traders may place stops below a previous low. Breakout traders may enter above resistance or below support. When price reaches those areas, there may be enough orders to create a fast move and a sharp reaction.
In Smart Money Concepts, traders often describe this as price seeking liquidity before the real move. That idea can be useful, but it should be handled carefully. The chart does not prove intent. It only shows behavior. What matters is whether price takes the level and then confirms rejection, displacement, or acceptance.
A sweep can create trapped traders. For example, price breaks above equal highs and attracts breakout buyers. If price quickly falls back below the highs, those buyers may be trapped. Some may exit, some may be stopped, and sellers may gain control. The failed breakout can create fuel for a move in the opposite direction.
However, not every sweep reverses. Sometimes price takes liquidity and continues because the breakout is real. That is why confirmation matters. A liquidity sweep is a scenario, not a prediction. The trader needs a rule for deciding when the scenario is confirmed and when it is invalidated.
Step-by-Step Usage
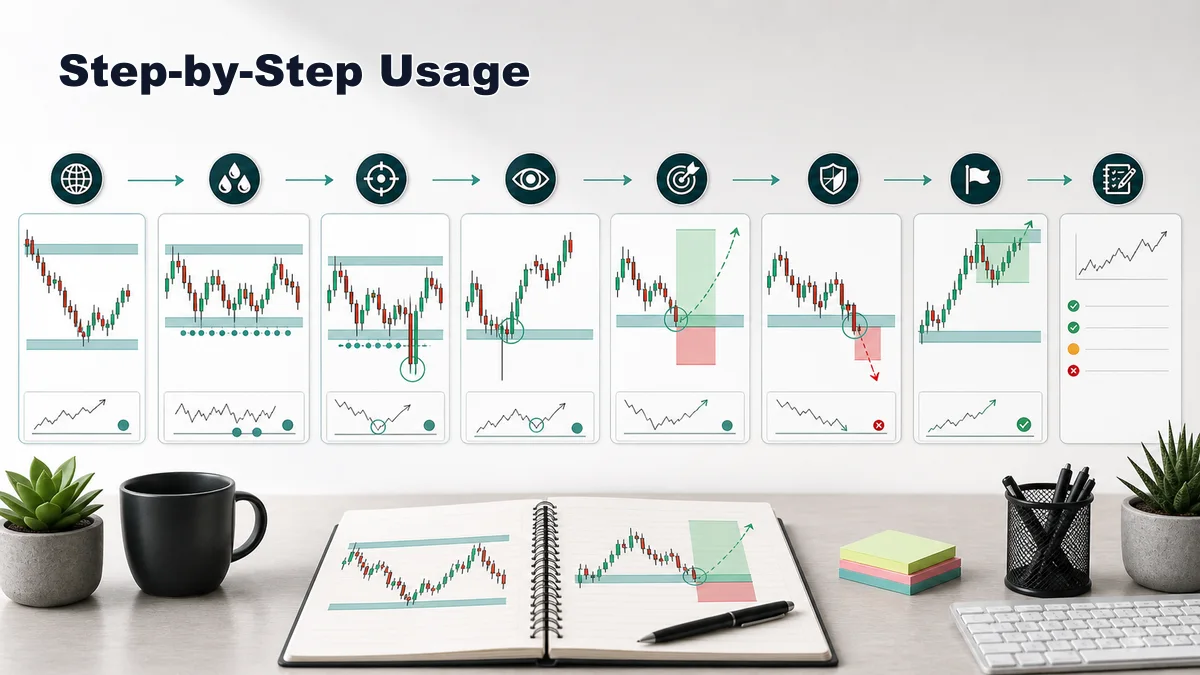
Step one is context. Decide whether the market is trending, ranging, or approaching a major level. A sweep in the direction of a higher-timeframe bias can be different from a sweep against a strong trend. If the broader chart is unclear, skip the trade or reduce the expectation.
Step two is liquidity mapping. Choose one active liquidity pool. It may be buy-side liquidity above equal highs or sell-side liquidity below equal lows. Do not mark ten possible sweep levels. The active level should be the one price is approaching now.
Step three is the sweep. Wait for price to move through the level. A wick alone is not enough. Watch whether price returns through the level, how fast it rejects, and whether the candle closes back inside the prior structure. Stronger sweeps usually show a clear failure to accept beyond the level.
Step four is confirmation. After a bearish sweep, look for displacement lower, a lower-timeframe break of structure, or a failed retest of the swept high. After a bullish sweep, look for displacement higher, a reclaim, or a break of short-term structure. The confirmation should be visible before entry.
Step five is risk planning. Invalidation often sits beyond the sweep extreme or beyond the structure that should hold if the idea is correct. Targets often use opposing liquidity, such as the range low after a bearish sweep of the range high, or the range high after a bullish sweep of the range low. Position size should be calculated before entry.
Confirmation Rules
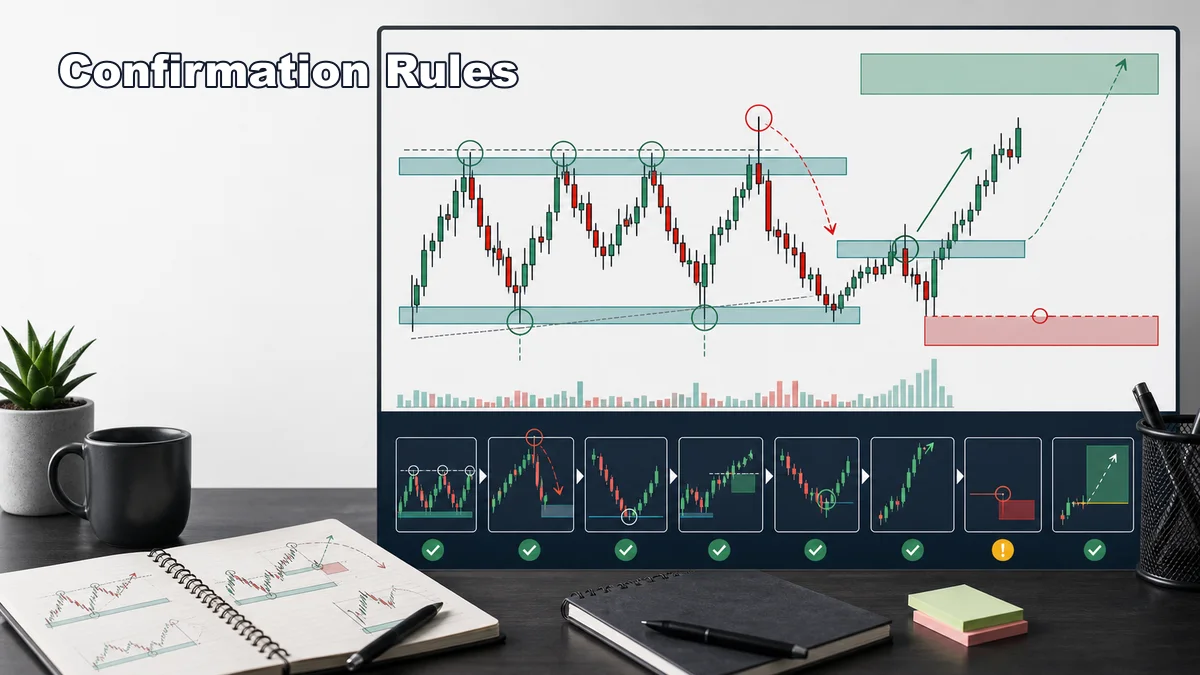
A useful liquidity sweep checklist should include location, sweep quality, reaction, structure, and risk. Location asks whether the level is obvious and meaningful. Sweep quality asks whether price clearly took liquidity or only made a tiny noisy wick. Reaction asks whether price rejected, reclaimed, or accepted beyond the level.
Structure confirmation is often the missing piece. A bearish sweep above a high becomes more useful if price then breaks a short-term low. A bullish sweep below a low becomes more useful if price then breaks a short-term high. This shift suggests that control may be changing after the liquidity event.
Displacement is another clue. A strong move away from the sweep area suggests urgency. Slow overlapping candles may show hesitation instead of confirmation. A fair value gap or imbalance after the sweep can sometimes become a retracement area, but only if it forms in the right context.
Risk confirmation is the final rule. If invalidation is unclear, the trade is not ready. A trader should know exactly what would prove the sweep idea wrong. For a bearish sweep, strong acceptance above the swept high may invalidate the short idea. For a bullish sweep, strong acceptance below the swept low may invalidate the long idea.
Examples of Liquidity Sweeps
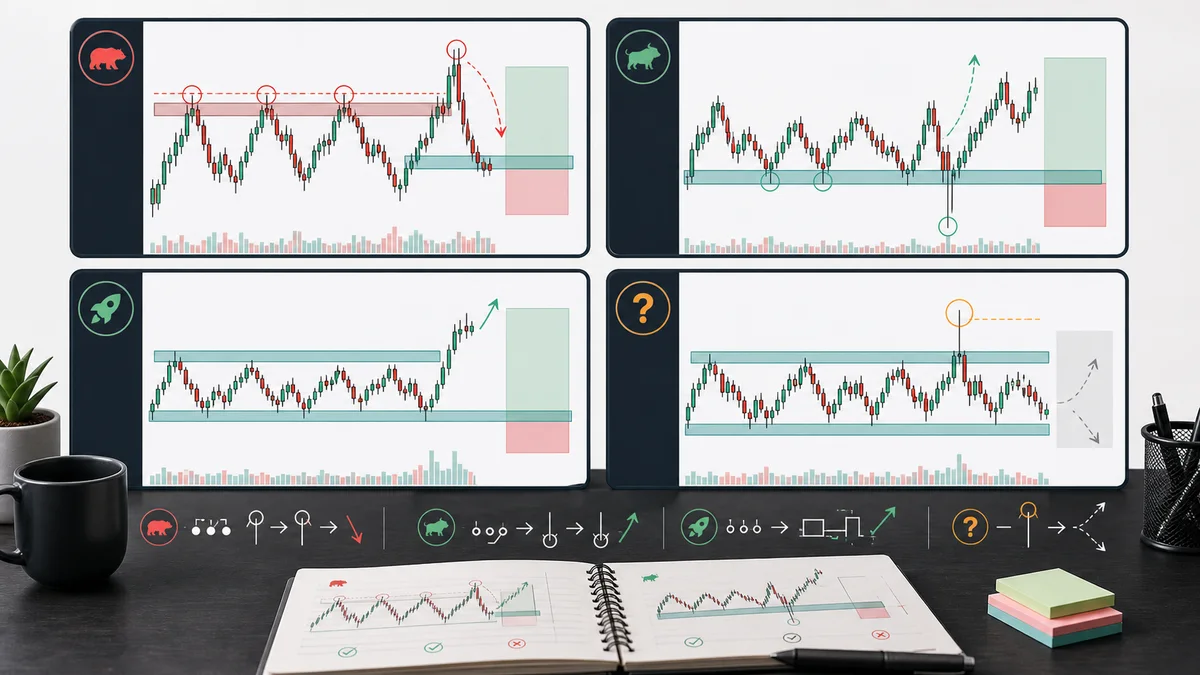
Example one: price forms equal highs inside a range. It pushes above the highs, closes back below them, and then breaks a short-term low with a strong candle. A bearish trader may see this as buy-side liquidity swept, followed by a shift lower. Invalidation may sit above the sweep high. A first target may be the middle of the range or sell-side liquidity near the range low.
Example two: price trades below a previous day low during an active session. It quickly reclaims the low and breaks a small lower-timeframe high. A bullish trader may see this as sell-side liquidity swept. The trade still needs a logical entry, stop below the sweep or reaction structure, and a target with enough room.
Example three: price breaks above a high and does not reject. It consolidates above the level and later retests it as support. This is not a failed sweep. It may be breakout acceptance. Calling every break a stop hunt is a beginner mistake because sometimes the market is genuinely accepting higher prices.
Example four: price wicks through a tiny intraday level in a choppy market. There is no higher-timeframe context, no displacement, and no structure shift. This is weak evidence. A disciplined trader may record the example but avoid risking money on it.
Common Mistakes
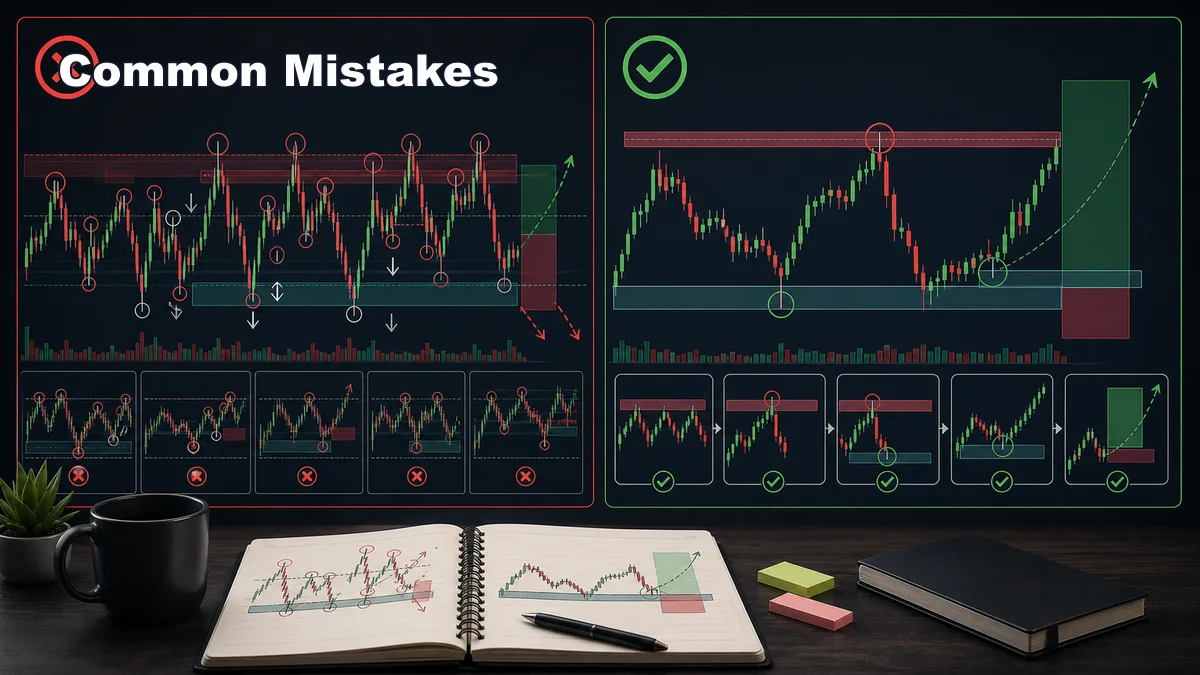
The first mistake is calling every wick a liquidity sweep. A sweep needs an obvious level, a move through it, and a meaningful reaction. A random wick in the middle of noise is not enough.
The second mistake is entering before confirmation. Many traders short immediately after price wicks above a high or buy immediately after price wicks below a low. That can work occasionally, but it often creates poor risk and emotional management. Waiting for structure can reduce low-quality entries.
The third mistake is ignoring breakout acceptance. If price breaks above a high and holds above it, the market may be accepting higher prices. Fighting that move just because liquidity was taken can be dangerous.
The fourth mistake is placing the stop randomly. The stop should be connected to invalidation. If the trade idea depends on the sweep extreme holding, then the stop and position size must respect that structure.
The fifth mistake is forgetting execution conditions. Spreads, news, low liquidity, and session changes can turn a clean-looking setup into a poor trade. A liquidity sweep is only one part of the plan. Risk and execution decide whether the plan is tradable.
Read the Smart Money hub: Continue with Smart Money, the Liquidity category, and the parent Liquidity in Trading guide to place this model inside a complete learning path.
Frequently Asked Questions
What is a liquidity sweep?
A liquidity sweep is a move beyond an obvious high or low that triggers orders and then returns back through the level. The sweep becomes useful only when price gives confirmation after the level is taken.
Is a liquidity sweep the same as a stop hunt?
Traders often use the terms together, but stop hunt is informal language. A chart can show price taking stops around an obvious level, but it does not prove intent by a specific market participant.
Can a liquidity sweep fail?
Yes. Price can sweep liquidity and continue in the same direction. That is why traders need confirmation, invalidation, and risk control before entering.
Key takeaways
- A sweep is defined around a level marked before price reaches it.
- Rejection, acceptance and continuation are separate possible outcomes.
- The phrase stop hunt is informal shorthand and does not establish intent.
- Confirmation, invalidation and maximum risk must be written before entry.
Use the sweep within a broader framework
Compare Liquidity in Trading: Pools, Sweeps and Execution Risk, Buy-Side vs Sell-Side Liquidity: A Practical Guide, Smart Money Concepts: Structure, Liquidity and Limits, ICT Trading Concepts: Structure, Liquidity and Risk, Market Structure: Trends, Swings, BOS and CHoCH and Fair Value Gaps: Identification, Validation and Failure to connect the sweep with liquidity, structure and imbalance without double-counting labels derived from the same candles.
References and methodology
Terminology note: Liquidity sweep, stop hunt, SMC and ICT are practitioner terms. The observable event is price trading beyond a predefined level; participant identity and intent cannot be verified from the candle chart alone.
Practise before considering real capital
Test the rules on historical charts or a demo account first. Review the XM account and demo information. Availability, protections and trading conditions depend on jurisdiction.
Affiliate disclosure: Học Làm Trader may receive a commission if you open an account through this link, at no additional cost to you. This relationship does not determine the educational conclusions.
Risk warning: This article is for education and general information only. It is not investment advice, a trade signal or an invitation to trade. Trading can result in loss of capital, and historical examples do not guarantee future results.
Related reading: Liquidity Sweeps Around MSNR Zones: Confirmation and Failure