


line chart vs candlestick chart MSNR A line chart usually connects closing prices, while a candlestick chart displays the open, high, low and close for each period. MSNR traders may use the line chart to simplify closing-price structure and candlesticks to inspect boundaries and reactions; neither view is inherently more accurate. The method should be treated as a testable chart-reading framework rather than a forecast. Before using it, define the market condition, confirmation event, invalidation price, transaction costs and maximum risk. This guide explains the rules, a repeatable workflow, common failure modes and the most relevant supporting concepts.
What Line Chart vs Candlestick MSNR Means in MSNR
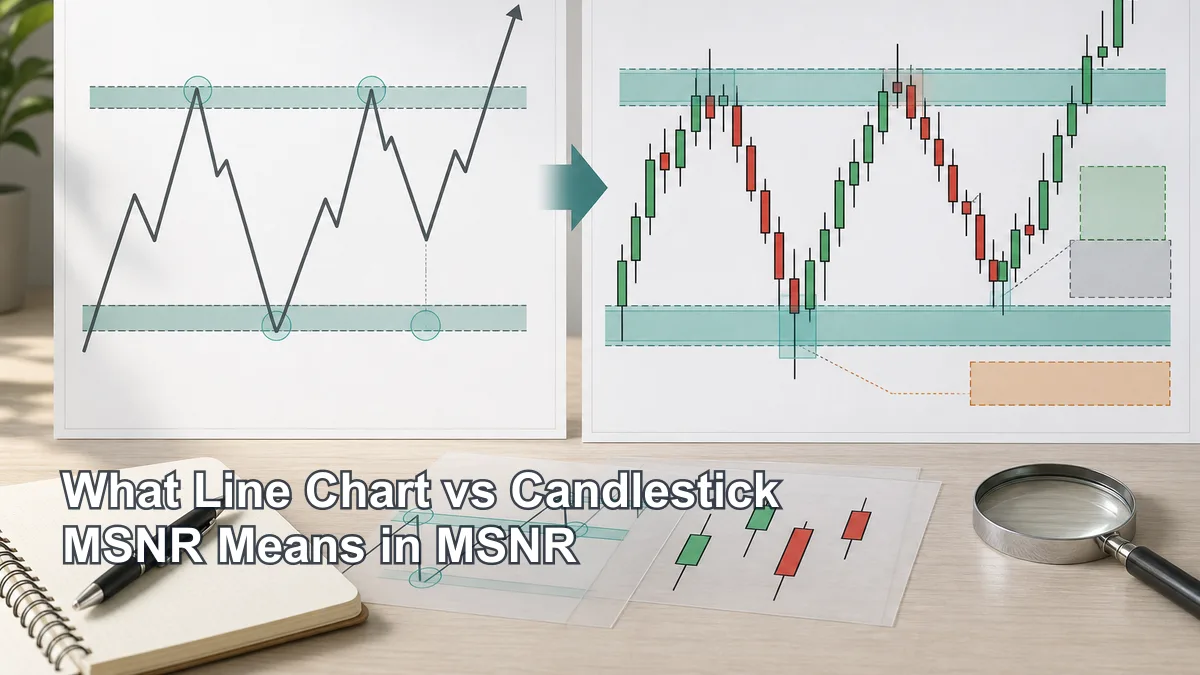
In MSNR, the comparison between line chart and candlestick chart is not a fight between two chart types. It is a workflow choice. A line chart usually connects closing prices, so it removes much of the visual noise created by intraperiod wicks. This makes it easier to see where price actually closed around swing highs, swing lows, range edges and reaction points. For beginners, that cleaner view can make support and resistance structure easier to identify.
A candlestick chart gives more information. Each candle shows the open, high, low and close for the selected period. That means the trader can see the body, wick, rejection, volatility and direction of pressure. In MSNR, this is important because levels are often treated as zones rather than thin lines. The candle body can help define a close-open area. The wick can show rejection, a sweep, a false break, or simply noise. The trader needs to decide which information matters for the plan.
A useful way to think about the difference is this: the line chart is the map, and the candlestick chart is the inspection tool. The map helps you avoid drawing twenty random levels. The inspection tool helps you refine one important level into a practical working zone. If the line chart shows no meaningful swing structure, the candle reaction may be too small to prioritize. If the line chart shows a clean swing but the candles show messy acceptance through the area, the level may need more caution.
This is why line chart support resistance can be helpful before detailed candle analysis. It removes the temptation to chase every wick. Once the broad area is visible, the trader can return to the candlestick chart and ask whether the zone is fresh, whether the body structure is clean, whether the wick is useful context, and where invalidation would sit.
The goal is not to make the chart look perfect. The goal is to make the decision process testable. A level should be easy to explain before the trade. If a trader can only justify the level after switching chart types five times, changing timeframes repeatedly, and redrawing the zone after price moves, the analysis may be too subjective.
Why It Matters Before Taking a Trade

The comparison matters before a trade because the chart type affects what the trader notices. A candlestick chart can make the market look more complex than it is. Every wick can appear to be a level. Every candle close can appear to be a signal. When the chart is noisy, a beginner may draw too many zones and then choose the one that supports the trade they already want to take.
A line chart can reduce that problem by showing the cleaner closing-price structure. If support or resistance is obvious on the line chart, it may represent a more meaningful swing area. If a level exists only because of one isolated wick, the trader should ask whether it is true structure or a temporary liquidity move. This does not mean wick levels are useless. It means they need context.
The opposite risk also exists. A trader who uses only the line chart may miss important candlestick information. A line chart can hide a deep sweep below support, a strong rejection wick, an engulfing candle at resistance, or a series of closes through the zone. These details can change how the setup is interpreted. Candlestick chart SNR analysis is valuable because it shows how price interacted with the area, not only where it closed.
Before taking a trade, MSNR traders need three things from the chart: a meaningful area, a possible reaction, and a place where the idea becomes wrong. The line chart helps with the first part. The candlestick chart helps with the second and third. If you skip the line chart, the area may be random. If you skip candles, the reaction and invalidation may be weak.
This matters most when risk is involved. A clean-looking level is not a trading signal by itself. The trader still needs a trigger, position size, stop-loss logic and room to the next opposing zone. A line chart may help decide where to pay attention, but the stop loss usually needs candle structure, wick extremes, volatility and acceptance or rejection around the zone.
A simple rule for practice is: simplify first, inspect second. Use the line chart to remove noise and locate the main support or resistance area. Then use the candlestick chart to refine the MSNR zone, define the trigger, and plan invalidation. This sequence can reduce impulsive entries and improve the quality of your trading journal.
Step-by-Step Chart-Reading Workflow
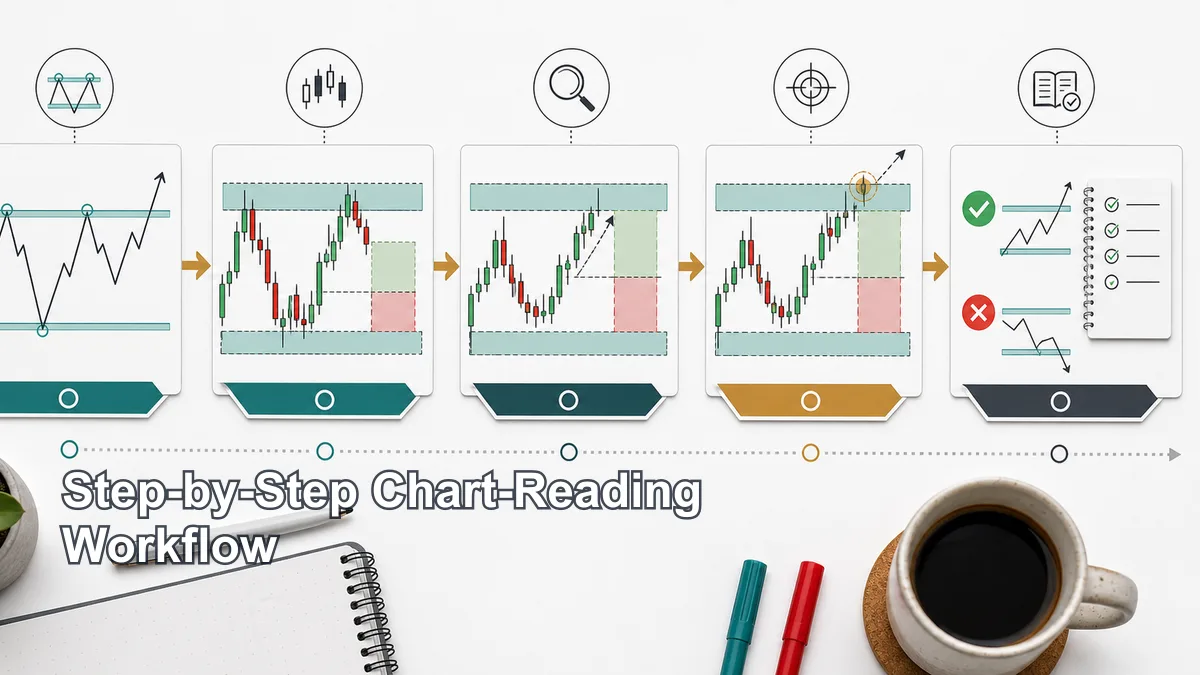
Use this workflow to practice MSNR chart reading without making the process too subjective. It is not a signal system. It is a structured way to decide whether a level deserves more study.
Step 1: Start with the trading timeframe. Decide which timeframe your trade idea belongs to. A 4-hour MSNR level, a 1-hour level and a 15-minute level do not carry the same weight. If you do not define the timeframe first, you may mix signals that do not belong together.
Step 2: Switch to the line chart. Look for the clean closing-price swings. Mark only the areas where price clearly changed behavior, stalled, reversed or respected a range edge. Do not force a level from every small bend. The line chart should make the major structure easier to see, not create a new layer of confusion.
Step 3: Ask whether the level is obvious. If the area is invisible unless you zoom aggressively, it may be too weak for beginner practice. A good MSNR candidate should be visible at a normal chart scale and should connect to a meaningful swing or reaction.
Step 4: Return to the candlestick chart. Study the same area with candles. Look for the candle bodies, wick extremes, close-open structure and rejection behavior. Decide whether the working zone should be based mostly on the body area, the wick rejection, or a combination. Be careful with one extreme wick that sits far away from the body structure.
Step 5: Judge freshness and touches. A fresh MSNR level has not been heavily revisited after it was created. An unfresh level may still matter, but it may require more confirmation. A line chart can show repeated closes near an area, while candles can show whether each touch actually consumed the zone.
Step 6: Watch the approach. Study how price returns to the level. Is the move fast, slow, corrective, impulsive, or choppy? A clean line-chart support area may be less attractive if candles are selling aggressively into it with no sign of slowing. A resistance zone may be less attractive for shorts if candles are closing strongly above nearby highs.
Step 7: Require a trigger. The trigger can be a rejection candle, lower-timeframe structure shift, failed break, retest, or another tested rule. The important point is that the trigger must be defined before entry. A line chart level plus candle reaction is still not enough if the trader has no entry rule.
Step 8: Save the before-and-after chart. A good review includes the line-chart view that identified the area and the candlestick view that refined it. This helps you learn whether the line chart actually improved your level selection or only made the chart look cleaner after the fact.
Entry, Invalidation and Stop-Loss Logic
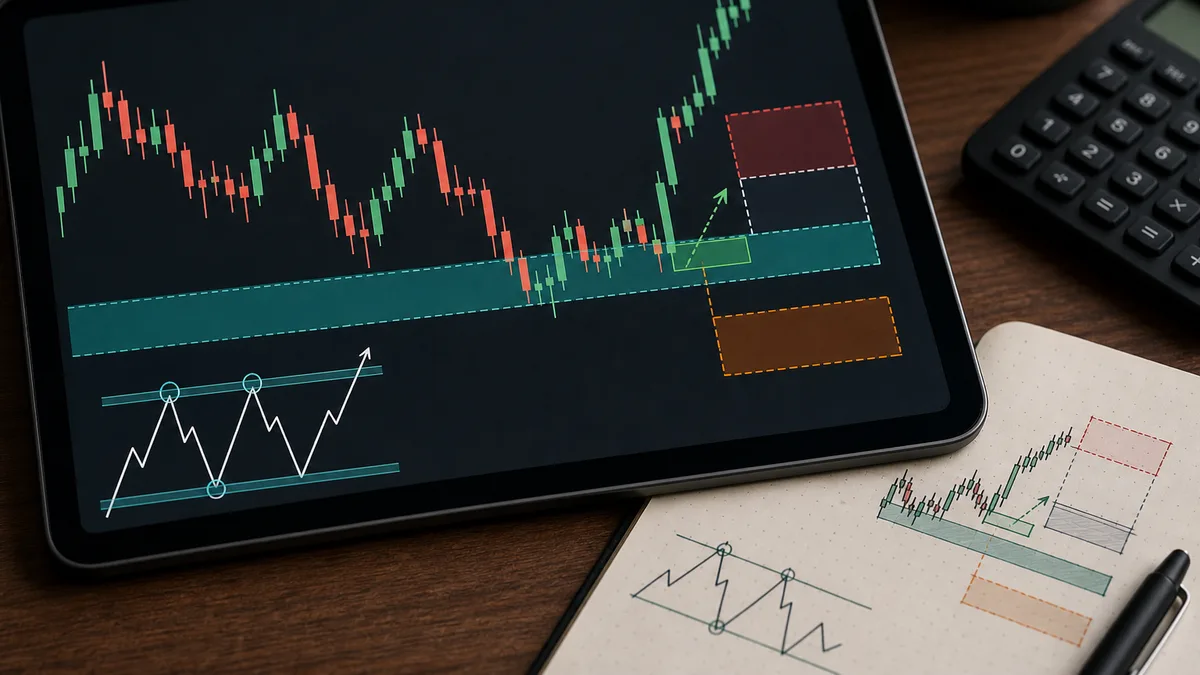
Entry logic should not come from the line chart alone. A line chart can identify a broad support or resistance area, but it does not show the full intraperiod behavior. For an MSNR setup, the trader usually needs candle evidence before deciding whether price is accepting or rejecting the area. The candlestick chart helps reveal whether price is sweeping, stalling, closing through, or respecting the zone.
For a possible long setup, the line chart may show that price is returning to a clean support area. The candlestick chart then becomes the decision tool. The trader may look for a rejection wick, a failed breakdown, a close back above the zone, or a lower-timeframe structure shift. These are examples, not instructions to trade. The point is that the entry trigger should be visible and repeatable.
For a possible short setup, the same logic applies around resistance. The line chart can show a clean swing high or range edge. Candles then show whether price is rejecting, accepting above, or breaking through with strength. If candles close strongly above resistance and hold there, the short idea may be invalid. If price rejects and the trigger appears, the trader can evaluate whether the risk is acceptable.
Invalidation is where the trade idea no longer makes sense. The line chart may suggest the broad level, but the candlestick chart often helps define the invalidation area. A stop loss may need to account for the wick extreme, the body zone, volatility and spread. If the stop sits inside normal candle noise, the setup can fail mechanically even if the broader idea was reasonable. If the stop is too wide, the reward-to-risk may not justify the trade.
This is why the chart-type decision is connected to risk. A trader who draws from a line chart but places a stop using only the line may ignore candle volatility. A trader who draws from a candle wick but ignores the line-chart structure may anchor the entire trade to a noisy extreme. MSNR works better when the broad structure and detailed candle behavior agree enough to create a clear plan.
Before entering, write the trade idea in one sentence. For example: “Price is testing a line-chart support area, candles are rejecting the MSNR body zone, and the idea is invalid if price closes below the rejection structure.” If you cannot write a sentence like that, the setup may not be clear enough to trade.
Common Mistakes and Checklist
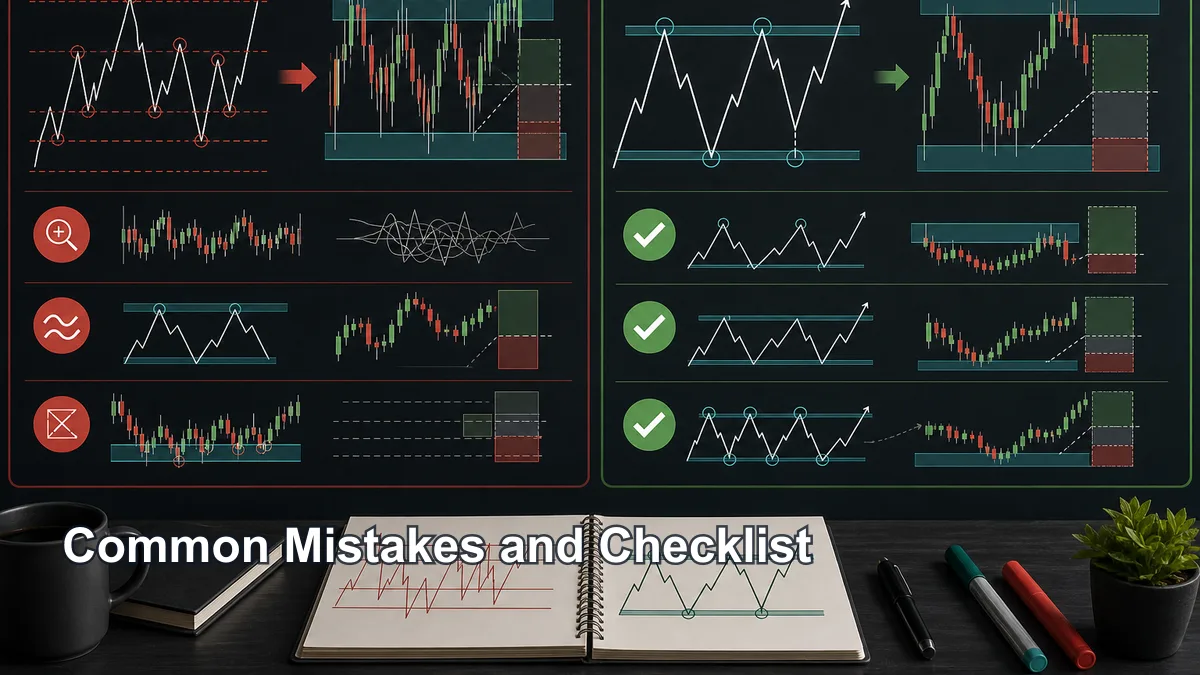
The first mistake is using the line chart as a shortcut for entries. A line chart can simplify structure, but it does not show enough detail to justify most entries by itself. Use it to locate the area, then return to candles for reaction and risk.
The second mistake is using candles without filtering noise. Candlestick charts contain useful detail, but they also contain distractions. If you mark every wick and every small reaction, the chart becomes too crowded. The line chart can help filter the most meaningful swing areas before you refine them with candles.
The third mistake is redrawing levels after the outcome. If price reacts slightly away from your marked zone, do not quietly move the line and call the analysis correct. Save screenshots before the trade. Honest review is more important than a perfect-looking chart.
The fourth mistake is treating wick extremes as automatically superior. Wicks can show rejection, but they can also show temporary volatility or liquidity sweeps. In MSNR, the candle body and close-open zone often deserve serious attention because they show where price accepted and closed.
The fifth mistake is ignoring invalidation. A level is not useful if it cannot help define where the idea is wrong. If the line chart suggests support but the candlestick chart shows repeated closes below the zone, the setup may be weaker than it looks.
Use this checklist when practicing line chart vs candlestick MSNR:
- The trading timeframe is defined before drawing levels.
- The line chart shows a clean swing or range area.
- The level is obvious without forcing the chart.
- The candlestick chart confirms a practical body or wick zone.
- The wick is used as context, not blindly copied.
- The level freshness and number of touches are reviewed.
- The entry trigger is defined before entry.
- Invalidation is based on chart structure, not emotion.
- The stop loss respects volatility and candle behavior.
- Both chart views are saved for later review.
CTA: To connect this comparison with the complete zone framework, read the Full MSNR Guide. For a broader foundation, study price action and candlestick reading before risking live capital.
FAQs About Line Chart vs Candlestick MSNR
Should I draw MSNR levels from the line chart or candlestick chart?
Use both for different jobs. The line chart can help identify clean support and resistance structure, while the candlestick chart helps refine the zone, reaction and invalidation.
Why do line charts help with support and resistance?
Line charts usually connect closing prices, so they reduce wick noise and make swing structure easier to see. This can help beginners avoid drawing too many random levels.
Are candlestick wicks important in MSNR?
Yes, but they should be interpreted with context. A wick can show rejection or a sweep, but a single wick should not automatically define the whole level without body and structure confirmation.
Can a line-chart level still fail?
Yes. Any support or resistance level can fail. That is why every MSNR setup needs a trigger, invalidation, stop-loss logic and position sizing.
Is this a trading signal?
No. This article is educational. It explains a chart-reading workflow, not a promise of profit or a recommendation to buy or sell.
Author note: Prepared by the Hoc Lam Trader editorial team for educational use. This guide was updated on May 12, 2026. Use chart screenshots, backtesting notes and demo review before live trading, and treat every example as a hypothesis rather than a guarantee.
Key takeaways
- A line chart usually connects closing prices, while a candlestick chart displays the open, high, low and close for each period.
- MSNR traders may use the line chart to simplify closing-price structure and candlesticks to inspect boundaries and reactions; neither view is inherently more accurate.
- Assign one role to each chart type and keep the zone rule unchanged when switching views.
- A valid plan separates location, trigger, invalidation, position size and exit logic.
A validation workflow you can reproduce
- Define the sample: choose the market, timeframe, session and date range before reviewing outcomes.
- Write the rule: Assign one role to each chart type and keep the zone rule unchanged when switching views.
- Record invalidation: identify the observable price event that disproves the setup.
- Include execution costs: account for spread, commission and slippage where relevant.
- Validate separately: test the finished rule on data that was not used to create it.
When this concept is unreliable
The comparison is unreliable when the preferred chart is chosen separately for every example after the reaction is known. Keep failed and skipped examples in the journal so the review is not limited to attractive winners.
Use this concept within a complete analysis
This method should remain connected to its parent framework and adjacent decision steps. Use Resistance Level in MSNR: How to Identify High-Quality Supply Zones, Support Becomes Resistance in MSNR: Role Reversal Guide, What Is MSNR Trading? Meaning, Logic and Beginner Rules, How MSNR Uses Close and Open Prices Instead of Random Wick Lines, MSNR Terminology: SNR, Fresh Level, Storyline, Rejection and Confluence and MSNR Chart Setup: What Tools, Timeframes and Templates You Need to compare definitions, establish context and avoid treating one signal as a complete trading system.
References and methodology
Terminology note: SMC, ICT and MSNR terms are practitioner conventions, not standardized exchange or regulatory definitions. This article defines the convention it uses and avoids inferring participant identity from candles alone.
- CME Group — Technical Analysis
- CFTC — Eight Things to Know Before Trading Forex
- CME Group — Chart Types: Candlestick, Line and Bar
Practise before considering real capital
Use historical charts or a demo account to test the written rules before considering live execution. Review the XM account and demo information. Availability, protections and trading conditions depend on jurisdiction, so review the applicable legal documents yourself.
Affiliate disclosure: Học Làm Trader may receive a commission if you open an account through this link, at no additional cost to you. This relationship does not determine the educational conclusions.
Risk warning: This article is for education and general information only. It is not investment advice, a trade signal or an invitation to trade. Trading can result in loss of capital, and past examples do not guarantee future results. Assess your own circumstances and risk tolerance.