


Forex trading timeframes The appropriate Forex timeframe depends on holding period, schedule, transaction costs and the specific job assigned to each chart. There is no universally best timeframe, and a faster chart does not automatically provide a better or earlier signal after spread and noise. The method should be treated as a testable chart-reading framework rather than a forecast. Before using it, define the market condition, confirmation event, invalidation price, transaction costs and maximum risk. This guide explains the rules, a repeatable workflow, common failure modes and the most relevant supporting concepts.
Definition: What Are the Best Timeframes for Forex Trading?
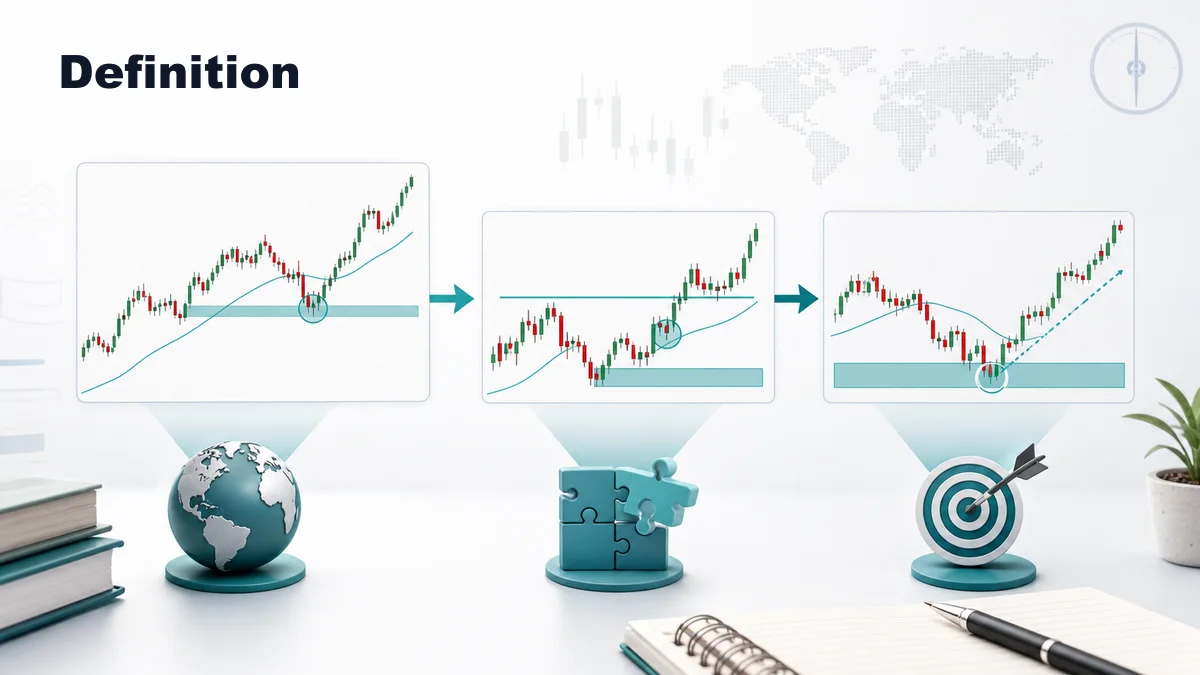
A timeframe is the amount of time represented by each candle on a chart. On a daily chart, each candle shows one trading day. On a one-hour chart, each candle shows one hour. On a fifteen-minute chart, each candle shows fifteen minutes of price movement. Forex traders use timeframes to organize context, setup, entry, stop placement, and trade management.
The best timeframe is not simply the fastest chart or the chart with the most signals. A useful timeframe should match the way you trade. If you can only check charts once or twice per day, a one-minute strategy will probably create stress and missed decisions. If you want short intraday trades, a weekly chart alone will not give enough execution detail.
For swing trading, common forex timeframes include the weekly, daily, and four-hour charts. The weekly chart gives the broad trend and major levels. The daily chart shows the trade idea. The four-hour chart can refine entry and risk. For day trading, common stacks include daily, four-hour, and one-hour, or four-hour, one-hour, and fifteen-minute charts. For scalping, traders may use one-hour, fifteen-minute, and five-minute charts, but the lower the timeframe, the more noise and execution pressure appear.
A good rule is to give each timeframe one role. The highest chart defines the environment. The middle chart locates the setup. The lowest chart times the trigger. When traders mix these jobs, they often become confused. They may use a five-minute candle to override a strong daily resistance level, or use a weekly trend to justify a poor intraday entry.
How to Identify the Right Forex Timeframe Stack
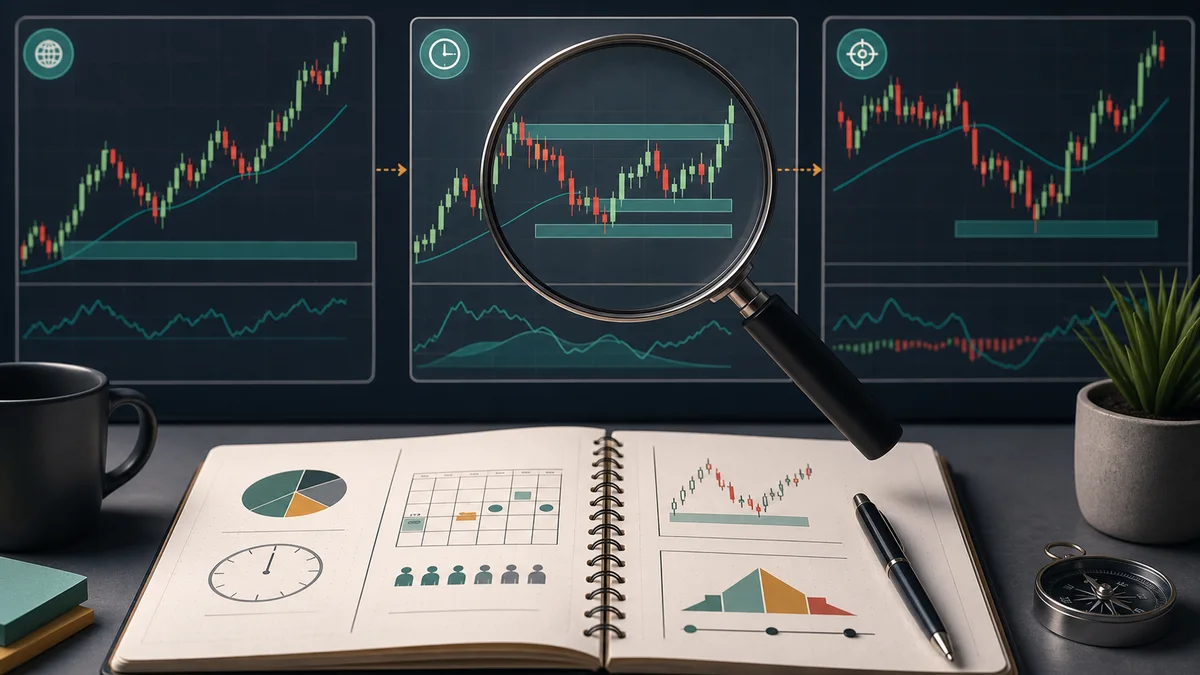
Start with your holding period. If you want to hold trades for several days, your execution chart should not be the one-minute chart. If you want trades that last minutes or hours, the weekly chart may be useful for context but too slow for entries. Your holding period should narrow the choices before you even open the chart.
Next, consider your schedule. A trader with a full-time job may be better suited to daily and four-hour analysis. A trader who can watch the London and New York sessions may use one-hour and fifteen-minute charts. Timeframe selection should fit your life, because a strategy you cannot execute consistently will not survive real conditions.
Then choose three charts with enough separation between them. Avoid stacking timeframes that are too close together, such as five-minute, three-minute, and one-minute. Those charts often show the same noise from slightly different angles. A cleaner stack has meaningful distance, such as daily, four-hour, and one-hour, or four-hour, one-hour, and fifteen-minute.
After that, define the job of each chart. The higher timeframe should answer: is the market trending, ranging, or near a major level? The middle timeframe should answer: is there a setup worth planning? The lower timeframe should answer: is there a trigger with clear invalidation?
Finally, test the stack in a journal. Save screenshots from all three charts before and after each trade. Over time, you will see whether your chosen timeframes give clear decisions or create confusion. The best timeframe stack is the one you can repeat and review, not the one that looks exciting for one trade.
Why Timeframe Selection Works in Forex
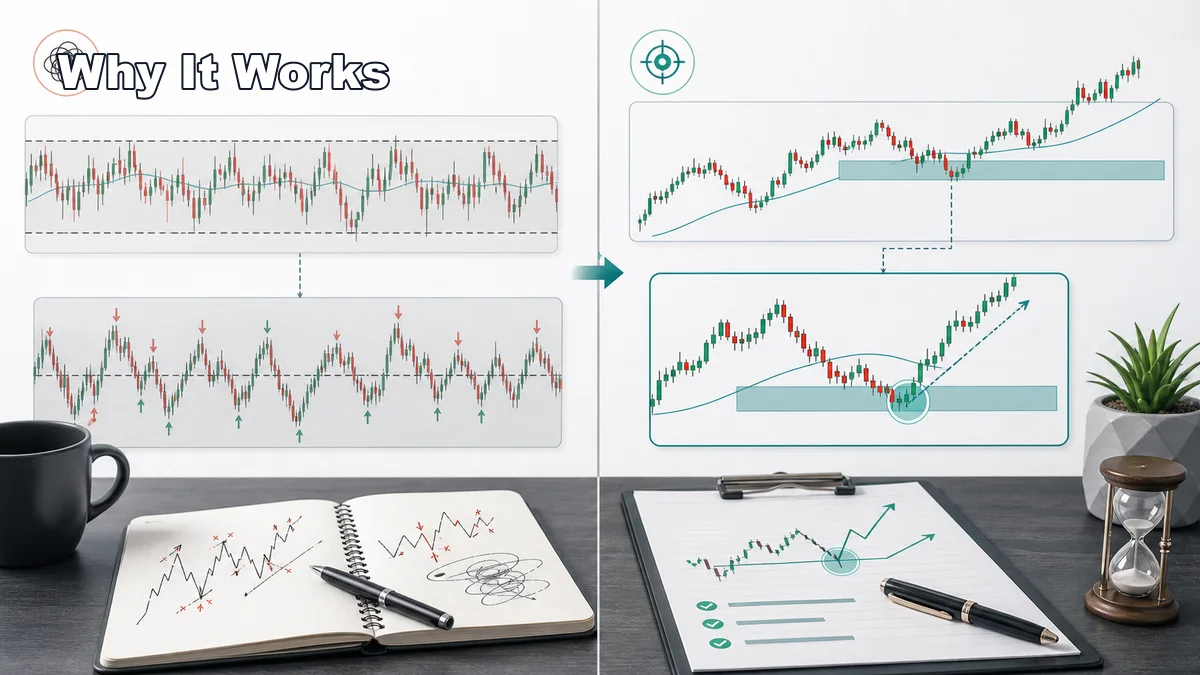
Forex markets are highly liquid, but they are still shaped by sessions, news, institutional flows, and technical levels. A lower timeframe may show a sharp move that looks important, while the higher timeframe shows that price is only reacting inside a larger range. Timeframe selection helps traders avoid overreacting to small movement.
The higher timeframe provides context. It shows major trend direction, broader structure, important support and resistance, and whether price has room to move. A bullish fifteen-minute pattern has more value when it forms from a daily support area than when it forms directly under daily resistance.
The middle timeframe gives the trade idea. It may show a pullback, breakout retest, range edge, liquidity sweep, or structure shift. This timeframe keeps the trader focused on a specific setup rather than jumping from one candle to another.
The lower timeframe refines timing. It can help reduce entry distance, define a cleaner stop, or wait for confirmation before entering. But the lower timeframe should not be treated as the main source of truth. It is a microscope. It can reveal detail, but it can also make random noise look meaningful.
Timeframe selection also improves risk planning. A setup based on the daily chart may need a wider stop and more patience. A setup based on the fifteen-minute chart may need tighter execution and faster management. When the trader knows which timeframe created the idea, the stop and target become more logical.
Step-by-Step Usage: Choosing and Trading Your Timeframes
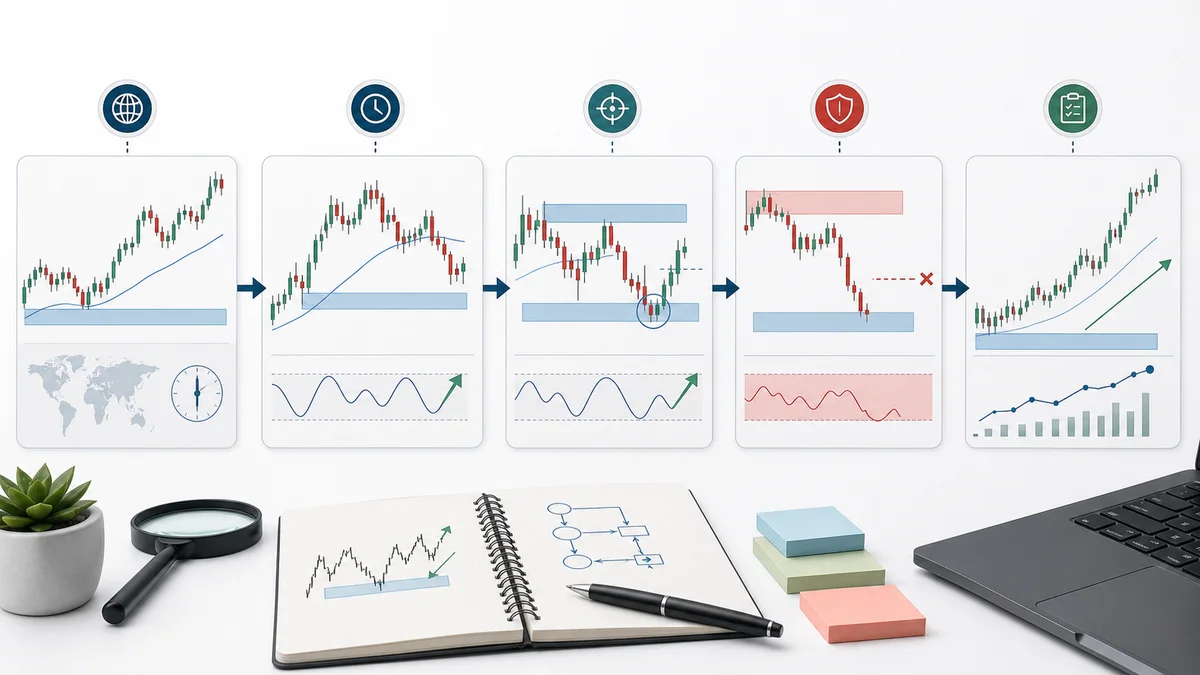
- Choose your trading style. Decide whether you are swing trading, day trading, or scalping. This choice controls the timeframe stack.
- Pick three timeframes. Use one higher chart for context, one middle chart for setup, and one lower chart for execution.
- Start from the top. Mark the larger trend, support, resistance, range boundaries, and major swing points before looking for entries.
- Move to the setup chart. Look for a pullback, range reaction, breakout retest, or structure shift that fits the higher-timeframe context.
- Use the lower chart for confirmation. Wait for a trigger such as rejection, minor structure break, retest, or candle close.
- Define invalidation. Know exactly where the trade idea is wrong before entry.
- Review the same stack. After the trade, compare the three charts and record whether the timeframes were aligned or conflicting.
For example, a day trader might use the four-hour chart to identify bearish structure, the one-hour chart to find a pullback into resistance, and the fifteen-minute chart to wait for a lower high and break downward. The trader is not shorting only because a fifteen-minute candle is red. The entry makes sense because the lower timeframe supports the higher-timeframe idea.
A swing trader might use the weekly chart to mark a major support zone, the daily chart to watch price reject that zone, and the four-hour chart to refine entry after a bullish shift. The trade may take longer to develop, but the larger chart provides more room and context.
Confirmation Rules for Forex Timeframe Selection
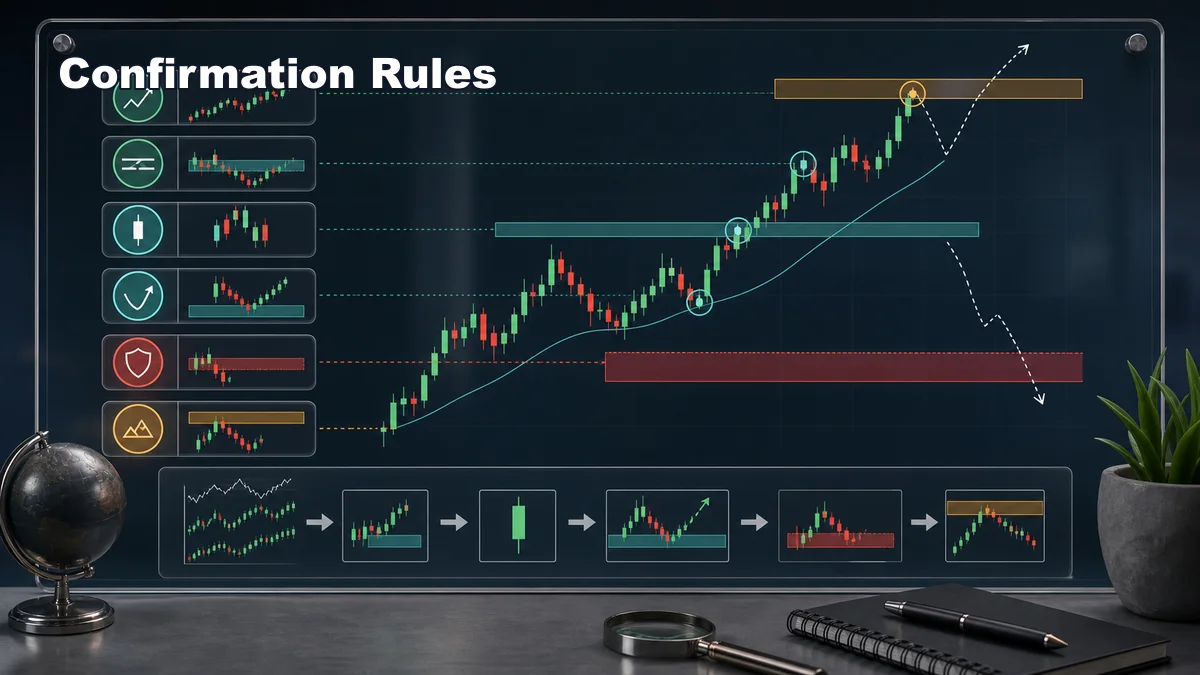
- Higher timeframe first: do not search for entry signals before you know the larger trend, range, and key levels.
- Use meaningful separation: choose timeframes far enough apart to show different information.
- Prefer location plus trigger: a lower-timeframe signal is stronger when it appears at a higher-timeframe level.
- Wait for acceptance: a candle close, retest, or follow-through is usually better than reacting to a wick.
- Respect conflict: if the higher timeframe and lower timeframe disagree, reduce risk, wait, or skip the trade.
- Match management to the setup: manage a daily setup differently from a five-minute scalp.
Confirmation does not mean perfection. Timeframes rarely align in a flawless textbook way. A higher-timeframe uptrend can include lower-timeframe bearish candles during a pullback. A daily range can contain a strong intraday trend. The goal is to know which timeframe controls the trade idea and which timeframe is only providing timing.
Another useful rule is to check the next obstacle. A lower-timeframe long setup may look clean, but if price is directly under a four-hour resistance zone, the reward may be limited. A short setup may look strong, but if price is already sitting on daily support, the trade may be late.
Examples of Best Forex Timeframe Combinations
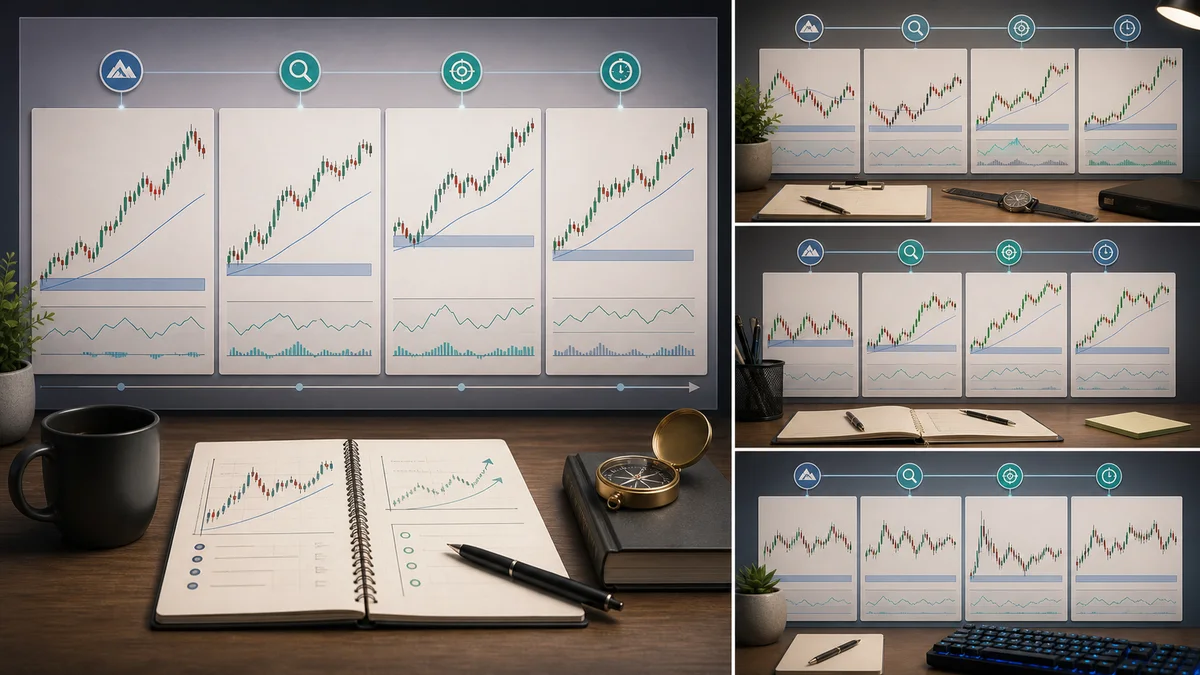
Swing trading example: weekly, daily, and four-hour. The weekly chart marks major direction and important zones. The daily chart shows the setup. The four-hour chart helps refine entry and stop placement. This stack is useful for traders who prefer fewer decisions and wider context.
Day trading example: daily, four-hour, and one-hour. The daily chart shows major levels. The four-hour chart shows intraday structure and setup location. The one-hour chart provides the trigger. This stack is often cleaner than jumping straight into the five-minute chart.
Short-term intraday example: four-hour, one-hour, and fifteen-minute. The four-hour chart defines direction and major zones. The one-hour chart shows the setup. The fifteen-minute chart helps time entries during active sessions. This is a practical stack for traders focused on London or New York.
Scalping example: one-hour, fifteen-minute, and five-minute. The one-hour chart provides context. The fifteen-minute chart locates the setup. The five-minute chart gives execution. This approach can work, but it requires discipline because spreads, news, and fast reversals matter more on low timeframes.
Position trading example: monthly, weekly, and daily. This stack is slower and less common for active forex traders, but it can help traders who hold for weeks or months. The daily chart may become the execution chart rather than the main context chart.
The best combination is the one that fits your strategy and temperament. If a timeframe stack makes you overtrade, lower the speed. If it gives too few opportunities, refine the setup rules before dropping to very noisy charts.
Common Mistakes When Choosing Forex Timeframes
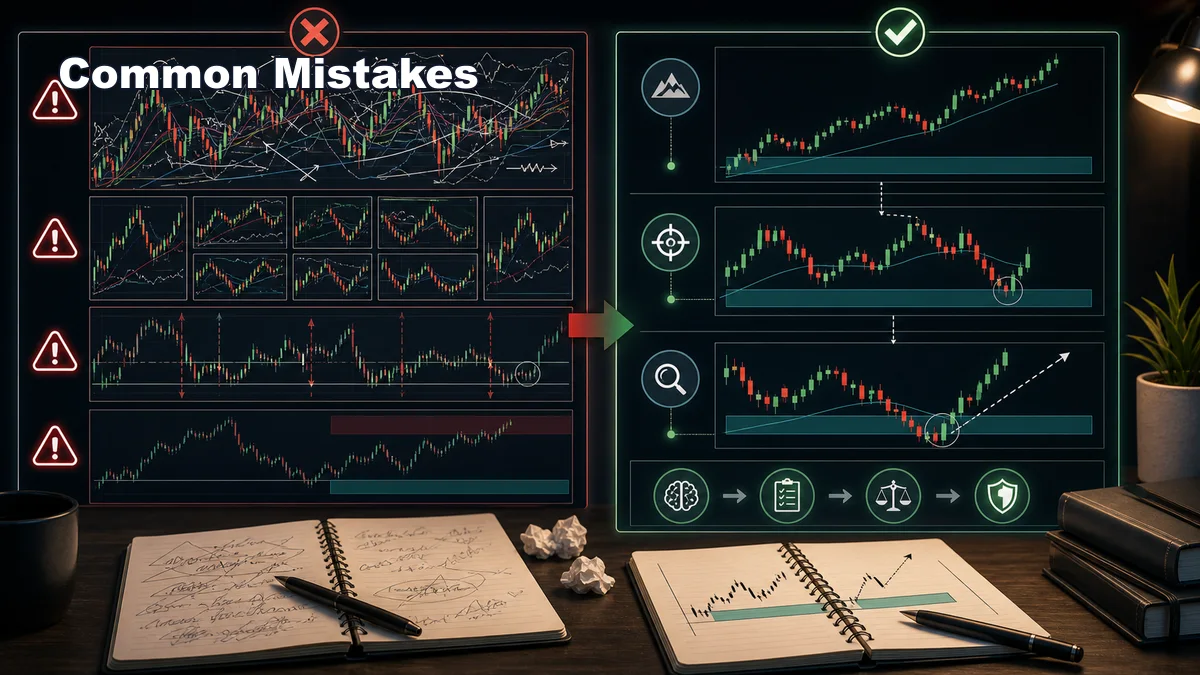
- Using too many timeframes: checking seven charts often creates analysis paralysis. Two or three charts are enough for most traders.
- Starting too low: beginners often begin on the five-minute chart and miss the larger level controlling the move.
- Changing the stack mid-trade: switching timeframes to justify an entry or avoid a stop usually damages discipline.
- Forcing alignment: timeframes do not always agree. Conflict is information, not a problem to explain away.
- Managing from the wrong chart: a daily setup should not be closed emotionally because of one small lower-timeframe candle.
- Ignoring session behavior: forex volatility changes around London, New York, rollover, and news releases.
The best timeframes for forex trading are the ones that help you make repeatable decisions. Start with a clean stack, define the role of each chart, and review your trades with screenshots. Keep connecting this skill back to the Price Action hub and the Multi-Timeframe category so timeframe selection becomes part of a complete trading process.
Key takeaways
- The appropriate Forex timeframe depends on holding period, schedule, transaction costs and the specific job assigned to each chart.
- There is no universally best timeframe, and a faster chart does not automatically provide a better or earlier signal after spread and noise.
- Choose one context chart, one setup chart and one entry chart, then keep the stack fixed during testing.
- A valid plan separates location, trigger, invalidation, position size and exit logic.
A validation workflow you can reproduce
- Define the sample: choose the market, timeframe, session and date range before reviewing outcomes.
- Write the rule: Choose one context chart, one setup chart and one entry chart, then keep the stack fixed during testing.
- Record invalidation: identify the observable price event that disproves the setup.
- Include execution costs: account for spread, commission and slippage where relevant.
- Validate separately: test the finished rule on data that was not used to create it.
When this concept is unreliable
Timeframe selection is unreliable when traders move lower after missing an entry or move higher to avoid accepting invalidation. Keep failed and skipped examples in the journal so the review is not limited to attractive winners.
Use this concept within a complete analysis
This method should remain connected to its parent framework and adjacent decision steps. Use Multi-Timeframe Analysis: Complete Guide, Top-Down Analysis in Trading: Step-by-Step Method, Trading Sessions: Complete Guide for Forex Traders, Asian Session Trading Strategy, New York Session Liquidity Sweep Strategy and Price Action Trading: Structure, Setups and Risk to compare definitions, establish context and avoid treating one signal as a complete trading system.
References and methodology
Practise before considering real capital
Use historical charts or a demo account to test the written rules before considering live execution. Review the XM account and demo information. Availability, protections and trading conditions depend on jurisdiction, so review the applicable legal documents yourself.
Affiliate disclosure: Học Làm Trader may receive a commission if you open an account through this link, at no additional cost to you. This relationship does not determine the educational conclusions.
Risk warning: This article is for education and general information only. It is not investment advice, a trade signal or an invitation to trade. Trading can result in loss of capital, and past examples do not guarantee future results. Assess your own circumstances and risk tolerance.