


MSNR chart setup An MSNR chart setup is the workspace used to mark zones, compare timeframes and record entry and invalidation rules. It should support the method rather than imply that a template or indicator pack can identify trades automatically. The method should be treated as a testable chart-reading framework rather than a forecast. Before using it, define the market condition, confirmation event, invalidation price, transaction costs and maximum risk. This guide explains the rules, a repeatable workflow, common failure modes and the most relevant supporting concepts.
What MSNR Chart Setup Means in MSNR
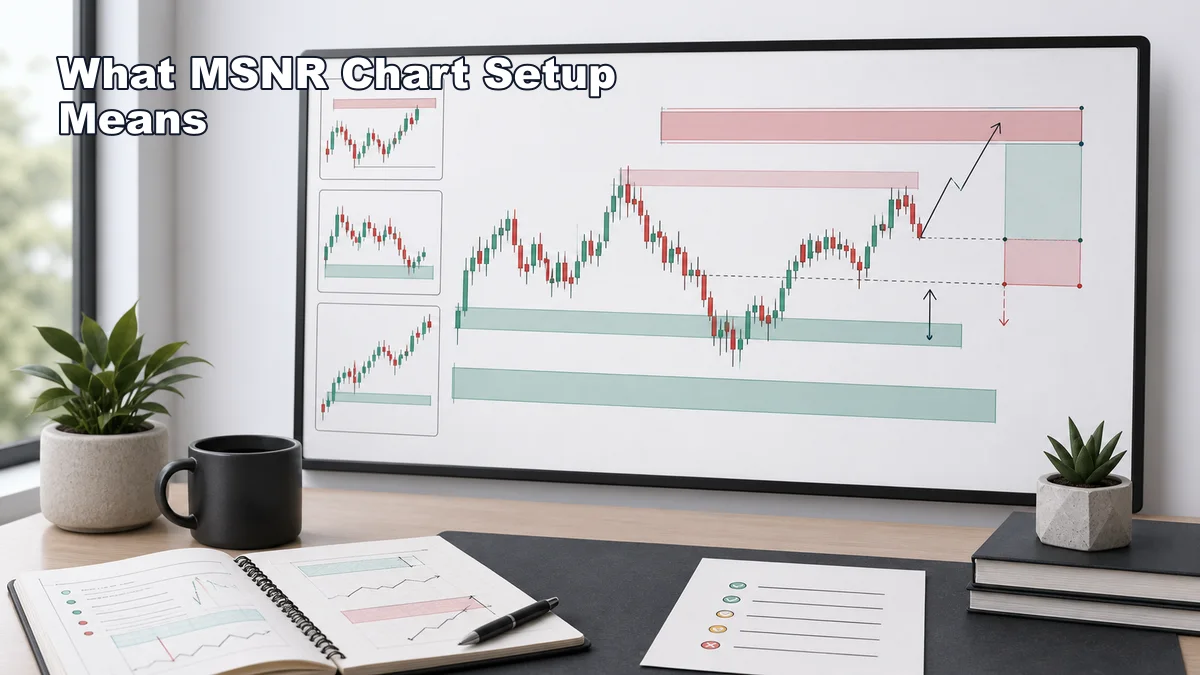
In MSNR, chart setup means the tools, layout, and template you use before you start looking for trades. It includes the charting platform, timeframes, support and resistance drawing style, watchlist, journal notes, and risk checklist. It does not mean a magic indicator pack or a secret template that tells you when to buy and sell.
A clean MSNR setup usually starts with price itself. Candlesticks, swing points, support zones, resistance zones, and market structure should be easy to see. Indicators can be useful when they answer a specific question, but they should not cover the chart. For most beginners, one or two optional tools are enough: a session separator, a volume view if the market supports it, a moving average for broad trend context, or a simple risk-reward tool for planning.
The template should make decisions easier. A trader should be able to open a chart and answer four questions: where are the important zones, what is the current structure, how is price reacting, and where is the idea invalid? If your setup does not help answer those questions, it may be decoration rather than process.
Think of the MSNR chart setup as your trading desk. The cleaner the desk, the easier it is to separate a real plan from impulse. The chart should support the strategy, not become the strategy.
Why It Matters Before Taking a Trade
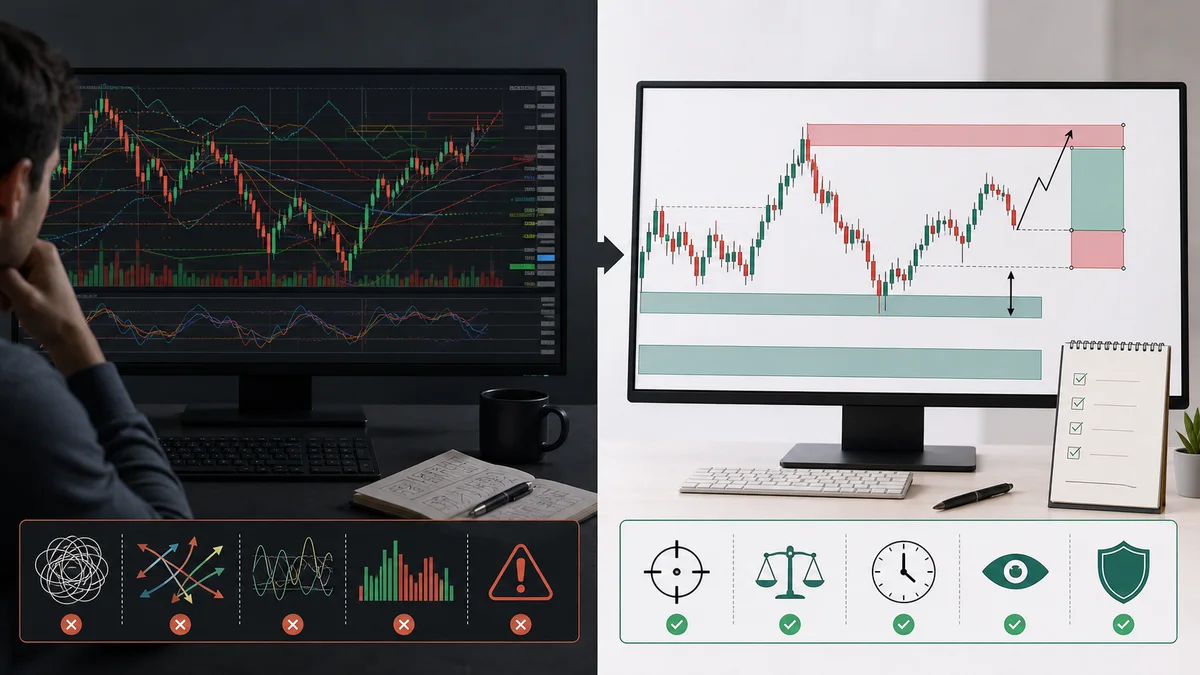
MSNR chart setup matters because many weak trades begin with a messy workspace. A trader may have several indicators, overlapping zones, trendlines from every swing, and multiple alerts firing at once. In that environment, it is easy to find a reason for almost any trade. The problem is not lack of information. The problem is too much unfiltered information.
A clean template improves trade location. MSNR depends on meaningful support and resistance zones, not random lines in the middle of noise. If your chart clearly separates higher-timeframe zones from lower-timeframe detail, you are less likely to buy directly into resistance or short directly into support.
It also improves patience. When the chart setup includes a watchlist, alerts at key zones, and a checklist, the trader does not need to stare at every candle. The plan becomes: mark the zone, wait for price to approach, observe the reaction, define invalidation, and only then decide. That structure reduces chasing.
Most importantly, a good setup makes risk visible. The stop-loss area, invalidation point, and next target should be part of the chart-reading process before entry. If a template only shows possible entries but does not help you see where the idea is wrong, it is incomplete.
For the broader method behind this setup, read the MSNR trading strategy guide. For deeper position sizing and stop placement, connect this workflow with practice MSNR without risking real money.
Step-by-Step Chart-Reading Workflow
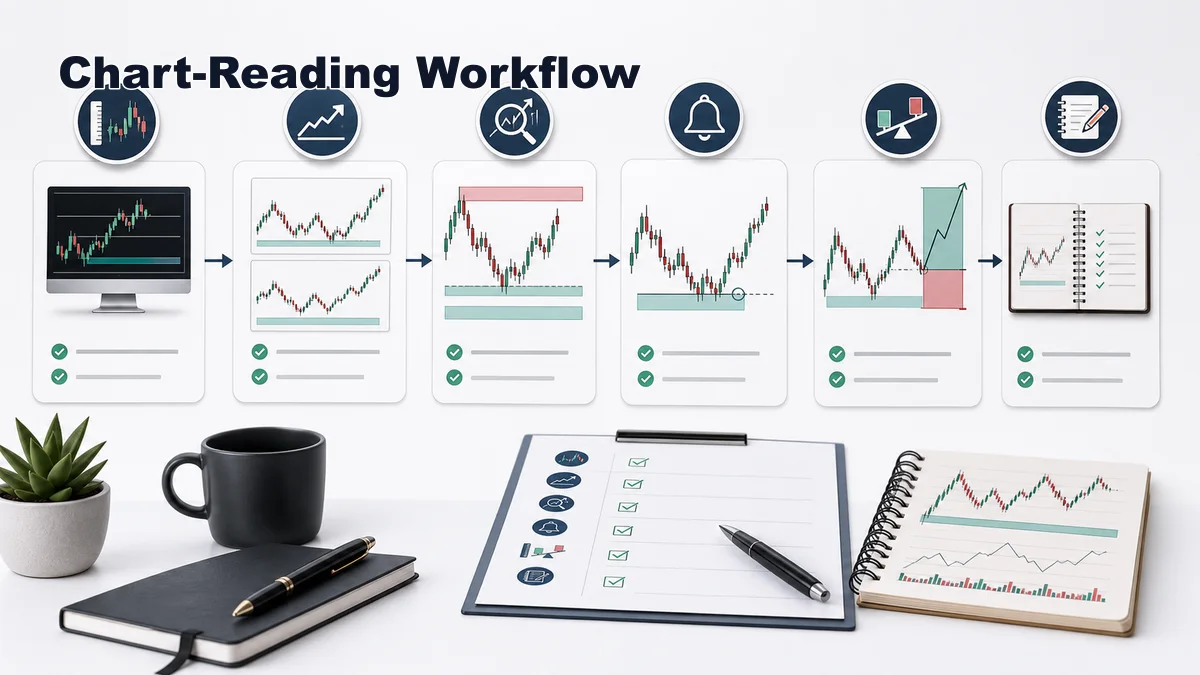
Use this workflow as a practical MSNR chart template. You can build it in TradingView or any platform that lets you save layouts, draw zones, set alerts, and use a risk-reward tool.
Step 1: Keep the Chart Clean
Start with candlesticks, a neutral background, and enough spacing to read swings clearly. Remove indicators you do not use in your written rules. If you cannot explain what an indicator does for your MSNR decision, hide it. The chart should make support, resistance, structure, and reaction obvious.
Step 2: Use a Higher-Timeframe Panel
Choose one higher timeframe for context. If you enter on the 15-minute chart, review the 4-hour or daily chart first. If you enter on the 1-hour chart, review daily and weekly levels. Mark only the major support and resistance zones that could affect the trade. This helps you avoid entering into a nearby obstacle.
Step 3: Use an Execution Timeframe
After context is clear, move to the timeframe where you plan entries. This is where you watch the approach into the zone, the reaction, and the trigger. Beginners should avoid jumping across too many timeframes. A simple pairing such as daily to 4-hour, 4-hour to 1-hour, or 1-hour to 15-minute is usually easier to review.
Step 4: Draw Zones, Not Thin Lines
Draw support and resistance as areas. A zone can include candle bodies, wick tolerance, repeated closes, range boundaries, or breakout-retest areas. Thin exact lines may look precise, but live markets often probe around levels before deciding. A zone gives you room to judge behavior without pretending every level is exact.
Step 5: Add Alerts at Decision Areas
Set alerts near the zones that matter. Alerts help you wait instead of chasing. When the alert triggers, do not enter automatically. Open the chart, read the approach, check the higher timeframe, and decide whether price is showing rejection, acceptance, breakout, retest, or no clear reaction.
Step 6: Use the Risk-Reward Tool Before Entry
Before placing a trade, use a risk-reward tool or manual calculation to map entry, stop, invalidation, and target. If the stop must sit beyond invalidation but the target is too close, the setup may not be worth taking. If the only way to make the trade look attractive is to move the stop inside normal noise, skip it.
Step 7: Save Screenshots for Review
A template becomes useful when you review it. Save screenshots before and after the trade. Record the higher-timeframe zone, execution timeframe reaction, entry reason, invalidation, stop loss, target, and result. Over time, this tells you whether your MSNR chart setup is helping or creating false confidence.
Entry, Invalidation and Stop-Loss Logic
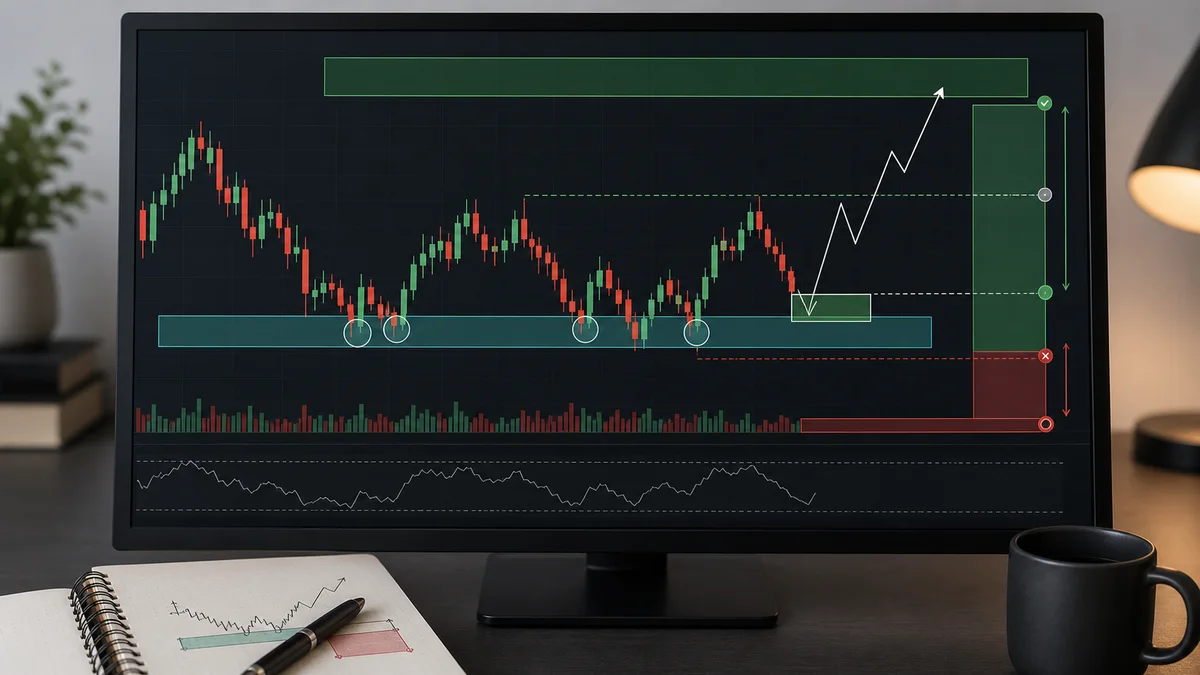
The best MSNR chart setup makes entry, invalidation, and stop-loss logic visible on the chart. Entry should not be the first decision. The order should be context, zone, reaction, invalidation, stop, position size, and then entry.
A rejection entry might appear when price reaches support, probes below the zone, and closes back above with follow-through. A breakout-and-retest entry might appear when price closes above resistance, returns to the old zone, and holds it as support. A range entry might appear when price rejects a clear range edge while the range remains valid. Each entry style needs its own invalidation rule.
Invalidation answers the question: what would prove this idea wrong? For a long setup at support, a decisive break below the zone or below the rejection low may invalidate the idea. For a short setup at resistance, a strong close above the zone or acceptance above resistance may invalidate it. The exact rule depends on your timeframe, but it must be clear before entry.
Stop loss should sit around that invalidation logic, with enough room for normal market movement. Position size should then be adjusted to match your risk limit. A clean template should make this sequence easy: draw the zone, define the failure point, measure the stop, check the target, and size the trade.
Common Mistakes and Checklist
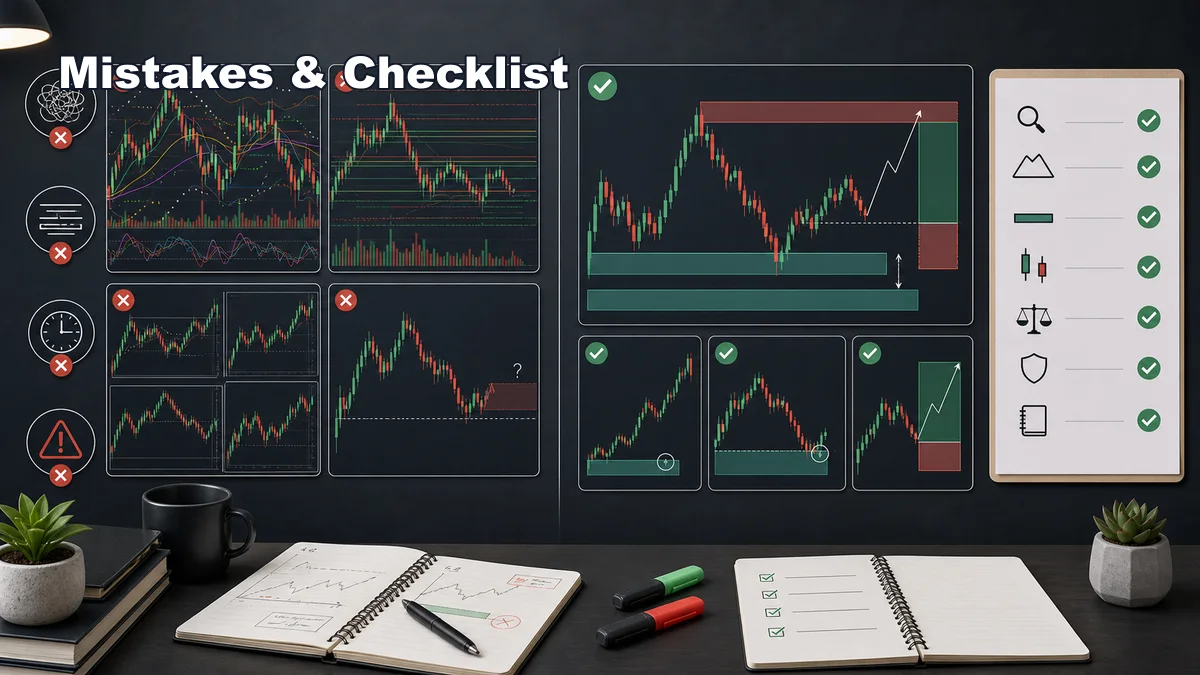
The first mistake is overloading the chart. Too many indicators, zones, colors, and labels make the trader feel informed while reducing clarity. The second mistake is changing timeframes after every candle. If your plan says daily context and 1-hour execution, follow that plan long enough to collect meaningful review data.
The third mistake is copying someone else’s template without understanding the rules behind it. A TradingView MSNR setup is useful only when it matches your market, timeframe, session, and risk process. The fourth mistake is drawing zones after you already want to enter. That creates confirmation bias. Mark major zones first, then wait.
The fifth mistake is forgetting invalidation. A chart can look beautiful and still be unusable if the trader cannot define where the idea is wrong. Every MSNR chart template should include a place for entry, stop, target, and post-trade notes.
Use this setup checklist before taking a trade:
- Is the chart clean enough to see price action?
- Have I checked the higher timeframe?
- Have I marked only the most obvious zones?
- Am I using zones instead of random thin lines?
- Is price actually near a decision area?
- Has price shown a tradable reaction?
- Do I know the invalidation point?
- Does the stop loss sit beyond invalidation?
- Is the target logical before the next obstacle?
- Have I calculated position size before entry?
Read the Full MSNR Guide: Continue with the full MSNR trading strategy guide and pair this template with practice MSNR without risking real money. A setup should make you more selective, not more eager to click.
Frequently Asked Questions
What tools do I need for an MSNR chart setup?
You need a reliable charting platform, candlestick charts, drawing tools for support and resistance zones, alerts, a risk-reward tool, and a journal. Indicators are optional and should be used only when they support your written rules.
What timeframes work best for MSNR chart setup?
Beginners should use one higher timeframe for context and one lower timeframe for execution. Common pairings include daily with 4-hour, 4-hour with 1-hour, and 1-hour with 15-minute. The best pairing depends on your market and schedule.
Should an MSNR chart template include indicators?
It can, but it does not need many. A simple moving average, session marker, or volume view may help some traders, but support and resistance zones, reaction, invalidation, and risk rules should remain the center of the template.
Key takeaways
- An MSNR chart setup is the workspace used to mark zones, compare timeframes and record entry and invalidation rules.
- It should support the method rather than imply that a template or indicator pack can identify trades automatically.
- Keep price, one timezone, fixed timeframe roles and a repeatable screenshot template before adding optional tools.
- A valid plan separates location, trigger, invalidation, position size and exit logic.
A validation workflow you can reproduce
- Define the sample: choose the market, timeframe, session and date range before reviewing outcomes.
- Write the rule: Keep price, one timezone, fixed timeframe roles and a repeatable screenshot template before adding optional tools.
- Record invalidation: identify the observable price event that disproves the setup.
- Include execution costs: account for spread, commission and slippage where relevant.
- Validate separately: test the finished rule on data that was not used to create it.
When this concept is unreliable
The setup is unreliable when changing colors, indicators or templates also changes the underlying trading rule. Keep failed and skipped examples in the journal so the review is not limited to attractive winners.
Use this concept within a complete analysis
This method should remain connected to its parent framework and adjacent decision steps. Use MSNR Terminology: SNR, Fresh Level, Storyline, Rejection and Confluence, What Is MSNR Trading? Meaning, Logic and Beginner Rules, How MSNR Uses Close and Open Prices Instead of Random Wick Lines, MSNR vs Random Support and Resistance: The Key Differences, Malaysian Support and Resistance: The Core MSNR Zone Framework and How to Draw Malaysian SNR Levels Step by Step to compare definitions, establish context and avoid treating one signal as a complete trading system.
References and methodology
Terminology note: SMC, ICT and MSNR terms are practitioner conventions, not standardized exchange or regulatory definitions. This article defines the convention it uses and avoids inferring participant identity from candles alone.
- CME Group — Technical Analysis
- CFTC — Eight Things to Know Before Trading Forex
- CME Group — Chart Types: Candlestick, Line and Bar
Practise before considering real capital
Use historical charts or a demo account to test the written rules before considering live execution. Review the Exness account and demo information. Availability, protections and trading conditions depend on jurisdiction, so review the applicable legal documents yourself.
Affiliate disclosure: Học Làm Trader may receive a commission if you open an account through this link, at no additional cost to you. This relationship does not determine the educational conclusions.
Risk warning: This article is for education and general information only. It is not investment advice, a trade signal or an invitation to trade. Trading can result in loss of capital, and past examples do not guarantee future results. Assess your own circumstances and risk tolerance.
Before saving a chart template, choose each chart role with the MSNR timeframe guide; a lower timeframe adds detail but does not improve a weak level.