


Wyckoff schematics are visual roadmaps that help traders read accumulation and distribution ranges. They organize the battle between supply and demand into phases, events, tests, and confirmation points. A schematic is not a prophecy. It is a framework for asking better questions: is supply being absorbed, is demand weakening, where is the range, and what would prove the idea wrong?
This guide belongs inside the THEORIES hub and the Wyckoff category. For the broader technical-analysis foundation, read Trading Theories: Complete Guide to Technical Analysis Frameworks. For the previous related article, study Wyckoff Distribution Explained, then compare it with Wyckoff Accumulation Explained.
Nothing here is financial advice or a trading signal. Wyckoff analysis can help organize price behavior, but it cannot guarantee a breakout, markdown, or profitable trade. Regulators such as the CFTC warn traders to understand risks before committing money, and Investor.gov notes that day trading is extremely risky.
Author and review note: Written by the HocLamTrader Editorial Team for educational chart study. Updated May 24, 2026. Examples are conceptual and should be tested with your own market, timeframe, volume data, spread, and execution rules.
Definition: What Are Wyckoff Schematics?
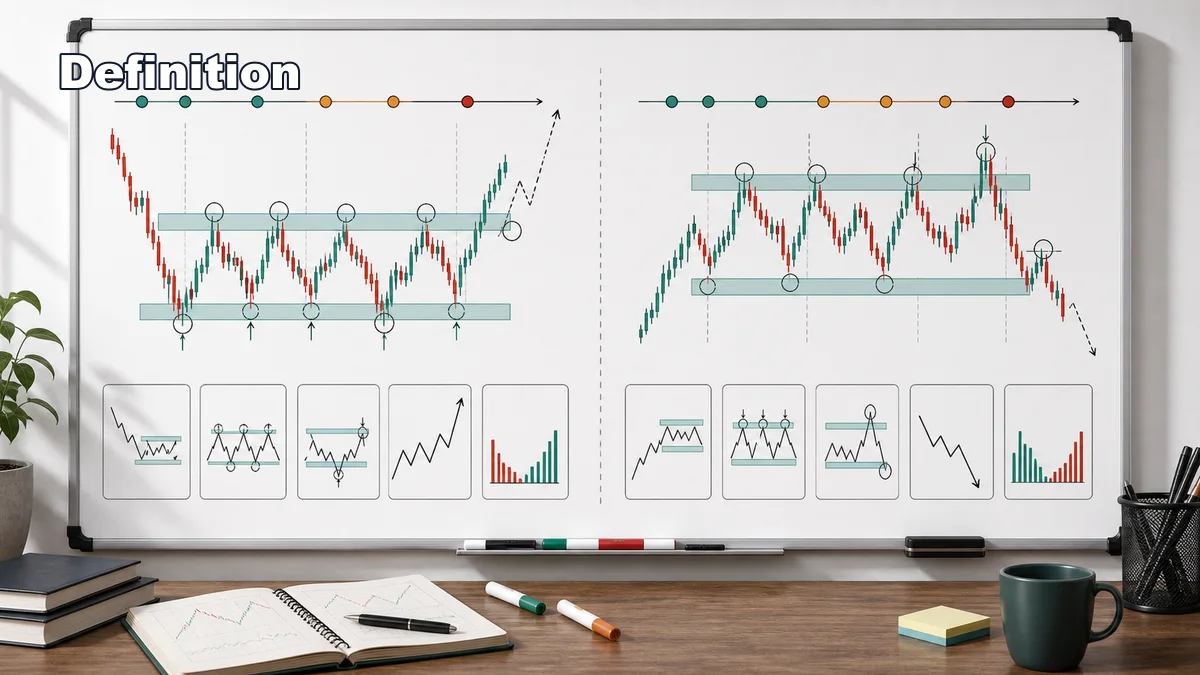
Wyckoff schematics are simplified diagrams of how a market may move through accumulation or distribution. An accumulation schematic usually describes a potential bottoming process after a decline. It may include a selling climax, automatic rally, secondary test, spring, sign of strength, last point of support, and markup. A distribution schematic usually describes a potential topping process after an advance. It may include a buying climax, automatic reaction, secondary tests, upthrust, sign of weakness, last point of supply, and markdown.
The schematic is a map, not the territory. Real charts rarely match the textbook sequence perfectly. The trader should focus on behavior: effort versus result, range boundaries, failed breaks, volume response, and whether one side is gaining control. A clean read does not require every label. It requires enough evidence to explain the market story.
In simple terms, Wyckoff asks whether a range is building cause. In accumulation, supply may be absorbed before markup. In distribution, demand may be absorbed before markdown. The schematic helps traders avoid treating every sideways range as random chop.
How to Identify Wyckoff Schematics on a Chart
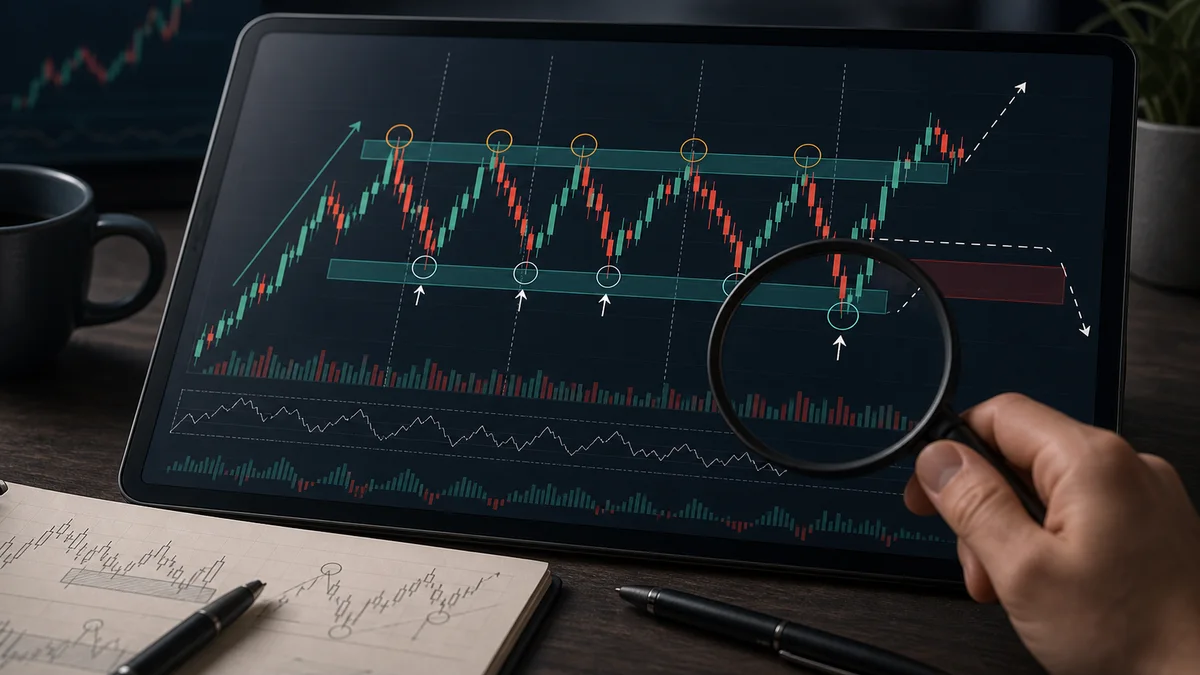
Start with the prior trend. Accumulation has more meaning after a clear decline because the range may show supply being absorbed. Distribution has more meaning after a clear advance because the range may show demand being absorbed. If there is no clear prior move, the range may simply be consolidation.
Next, mark the trading range. In accumulation, the selling climax and automatic rally often define the first support and resistance area. In distribution, the buying climax and automatic reaction often define the first range boundary. These are zones, not perfect lines.
Then study the tests. A secondary test near the low of an accumulation range should show whether sellers can still create downside result. A secondary test near the high of a distribution range should show whether buyers can still create upside result. Later failed breakdowns or failed breakouts can become important events, but only if price reacts back into the range.
Finally, compare effort and result. High volume with little progress can suggest absorption. Wide candles with follow-through can suggest control. If volume data is not reliable, focus on candle spread, closing location, reaction speed, and structure.
Why Wyckoff Schematics Work
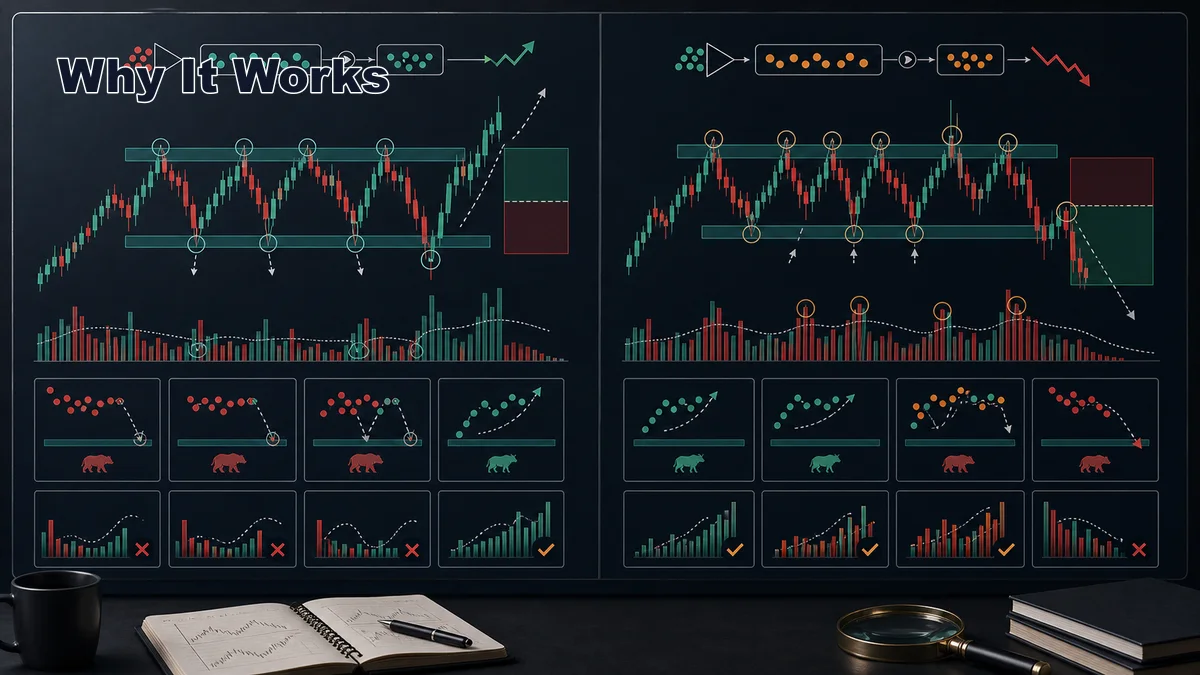
Wyckoff schematics work because large positions usually need liquidity and time. A market may range while stronger hands buy from weak sellers or sell into eager buyers. The range gives the trader a way to observe whether price is accepting lower levels, rejecting higher levels, absorbing supply, or failing to attract demand.
The method also works because it discourages impulsive prediction. A trader does not need to call the exact bottom or top. Instead, the trader waits for evidence. In accumulation, evidence may include a spring recovery, improving rallies, and a sign of strength. In distribution, evidence may include a failed upthrust, weaker rallies, and a sign of weakness.
The law of effort versus result is especially useful. If heavy selling cannot push price much lower near support, supply may be losing effectiveness. If heavy buying cannot push price meaningfully higher near resistance, demand may be weakening. These clues do not guarantee the next move, but they help the trader build a testable scenario.
Step-by-Step Usage for Reading Schematics
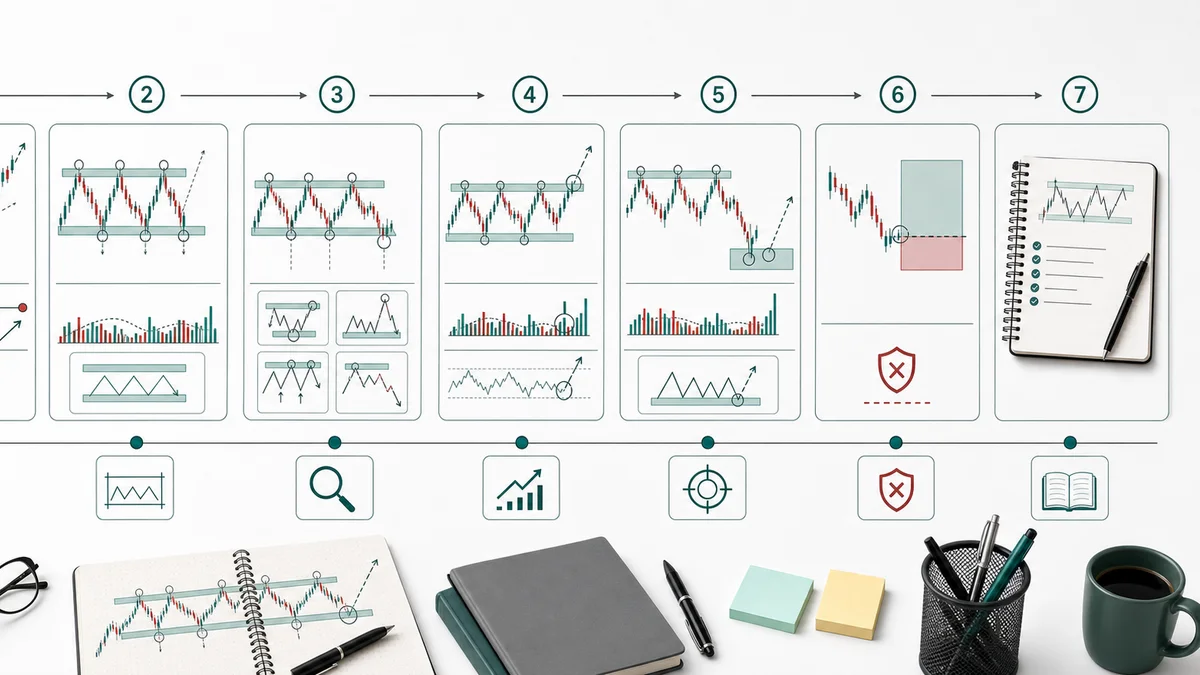
Step one is context. Decide whether the market is coming from a decline, an advance, or a larger range. This helps you choose whether accumulation, distribution, reaccumulation, or redistribution is the better hypothesis.
Step two is range mapping. Mark the obvious high and low of the trading range, then divide the range into key reaction areas. Avoid redrawing boundaries after every candle. Only adjust when price proves a cleaner structure.
Step three is event reading. Look for climaxes, automatic reactions, secondary tests, springs, upthrusts, signs of strength, signs of weakness, last points of support, or last points of supply. Do not require every event. Look for the events that explain the current range.
Step four is confirmation. In accumulation, the trader may wait for a spring reclaim or a sign of strength followed by a last point of support. In distribution, the trader may wait for an upthrust failure or a sign of weakness followed by a last point of supply.
Step five is risk planning. Invalidation should be tied to the schematic. If an accumulation idea depends on a spring holding, a breakdown that accepts below the range weakens the idea. If a distribution idea depends on an upthrust failure, acceptance above the range can invalidate the short thesis.
Confirmation Rules for Wyckoff Schematics
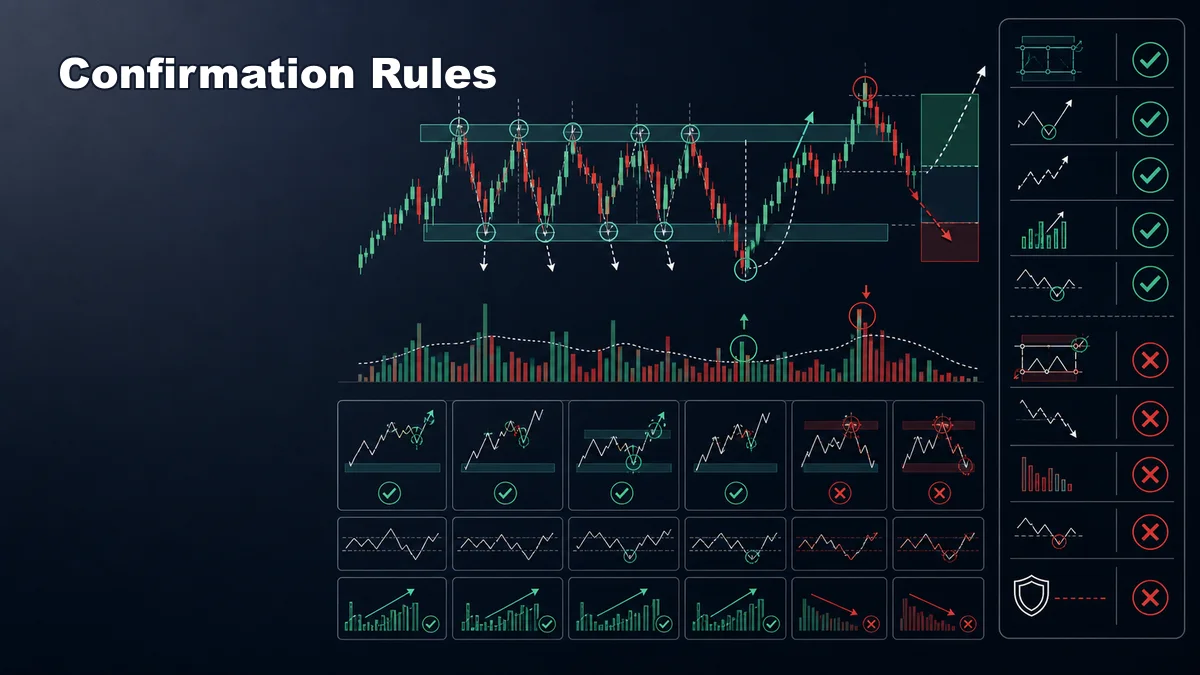
A useful Wyckoff checklist should include context, range clarity, tests, effort versus result, confirmation event, and invalidation. If the range is unclear, the schematic will usually be unclear. If the prior trend is missing, the labels may be less meaningful.
For accumulation, stronger evidence may include reduced downside result on tests, a spring that quickly reclaims the range, stronger rallies from support, a sign of strength through resistance, and a controlled pullback that holds as a last point of support.
For distribution, stronger evidence may include reduced upside result on tests, an upthrust that fails back into the range, stronger reactions from resistance, a sign of weakness through support, and a weak rally that fails as a last point of supply.
Risk confirmation is the final rule. If you cannot define where the schematic is wrong, the setup is not ready. The purpose of the schematic is not to impress the chart. It is to create a decision process that can be reviewed later.
Examples of Wyckoff Schematics
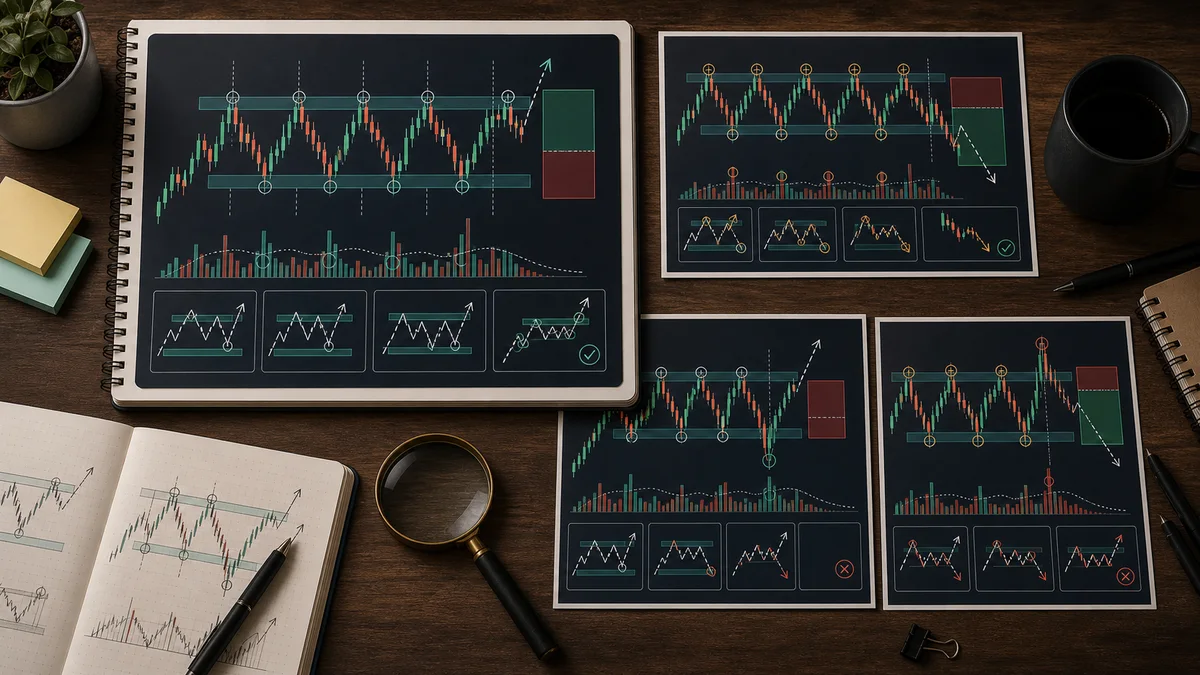
Example one: after a long decline, price sells off sharply, rebounds, and then retests the low with less downside progress. Later it dips below support, quickly reclaims the range, and rallies through the midpoint. This can support an accumulation read, especially if a later pullback holds above support.
Example two: after a strong rally, price forms a range near the highs. A breakout above resistance fails quickly, returns inside the range, and then breaks the midpoint with strong selling. This can support a distribution read, especially if a later rally fails below the upthrust area.
Example three: price dips below an accumulation range but cannot reclaim it. That is not a good spring. It may be a real breakdown. A disciplined trader revises the schematic instead of forcing the label.
Example four: price breaks above a distribution range and holds above it. That is not a clean upthrust failure. It may be continuation or reaccumulation. The trader should respect acceptance rather than keep shorting a failed thesis.
Common Mistakes When Reading Wyckoff Schematics
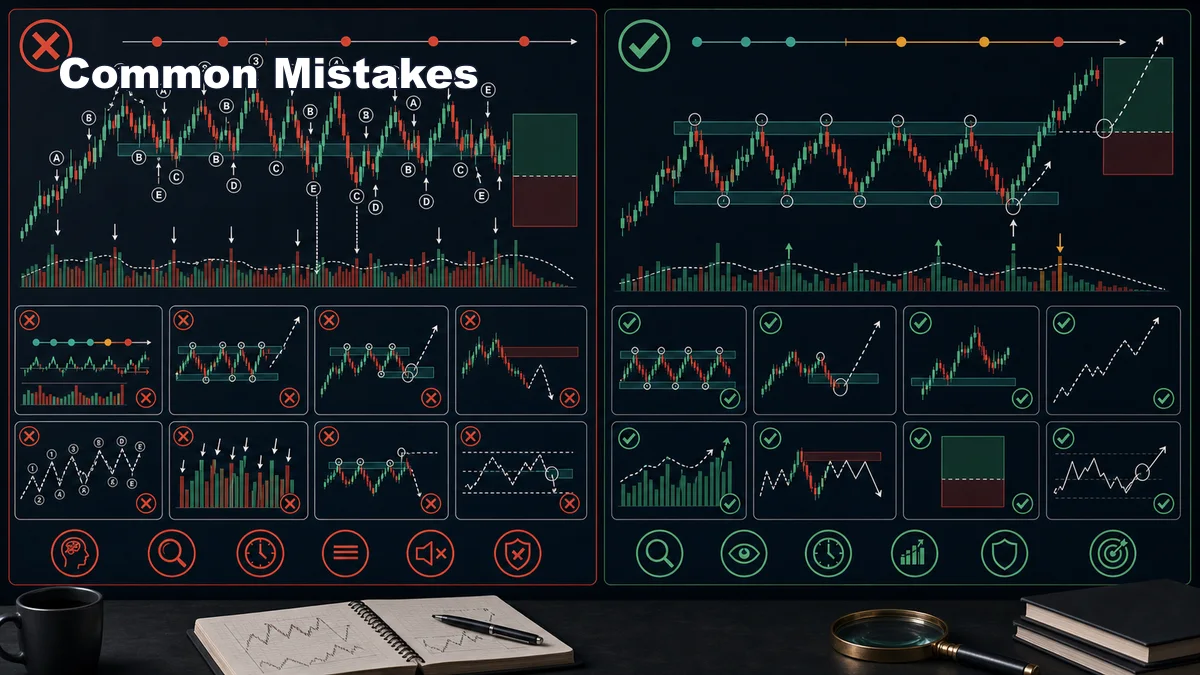
The first mistake is forcing every range into accumulation or distribution. Some ranges are simply balance areas. Others are continuation pauses. A Wyckoff schematic needs context and evidence.
The second mistake is memorizing labels without reading behavior. PS, SC, AR, ST, spring, SOS, LPS, BC, UT, SOW, and LPSY are useful terms only when they describe supply-demand behavior. Labels without behavior create false confidence.
The third mistake is entering during Phase B too aggressively. Phase B can be long and choppy. Traders often lose patience before the confirmation event appears.
The fourth mistake is ignoring invalidation. A spring that fails to reclaim the range is not bullish confirmation. An upthrust that accepts above resistance is not bearish confirmation. Let the market cancel weak ideas.
The fifth mistake is using Wyckoff without a journal. Schematics are visual, so screenshots matter. Save the chart before the event, after confirmation, and after the outcome. Over time, your journal will show whether you are reading behavior or only forcing templates.
Read next: Continue with the THEORIES hub, the Wyckoff category, Wyckoff Distribution Explained, and Wyckoff Accumulation Explained to build a cleaner accumulation-distribution learning path.
Frequently Asked Questions
Are Wyckoff schematics reliable?
They are useful frameworks, not guarantees. A schematic becomes more reliable only when context, range behavior, confirmation, and invalidation align.
Do real charts need to match the textbook schematic exactly?
No. Real charts are usually imperfect. Focus on supply-demand behavior, tests, effort versus result, and confirmation rather than exact labels.
What is the difference between accumulation and distribution schematics?
Accumulation studies possible supply absorption before markup. Distribution studies possible demand absorption before markdown.
The schematic labels become useful only when connected to observable behavior. Review how a Spring, reclaim and Test develop in accumulation, and compare them with the UTAD, Test and Sign of Weakness sequence in distribution.
Place in the learning route: Use the Wyckoff method pillar as the starting point, then return to these schematics to compare accumulation and distribution hypotheses with context and invalidation.