


Technical Analysis Trading Guides
Educational guides to technical-analysis frameworks including Dow, Elliott, Wyckoff, Gann and indicator-based methods.
Gann Theory: Angles, Time Cycles and Limitations
Understand Gann angles, price-time scaling and cycle concepts, including chart construction, subjectivity, testing requirements and...

Chart Patterns: Continuation, Reversal and Confirmation
Learn continuation and reversal chart patterns, objective boundaries, confirmation, measured targets, invalidation and common hindsight...
Indicator Mistakes: Overfitting, Duplication and Lag
Avoid common technical-indicator mistakes including duplicate signals, overfitting, ignored market regimes, lag and untested parameter...

Smart Money Concepts: Structure, Liquidity and Limits
Learn how Smart Money Concepts organize structure, liquidity, displacement and reaction zones, including confirmation rules,...
Breaker Blocks: Formation, Validation and Failure
Learn how breaker blocks are defined after a failed reaction zone, with structure, retest, confirmation,...

Point of Interest: Zones, Validation and Invalidation
Learn how a trading point of interest is selected, narrowed and validated using structure, reaction...
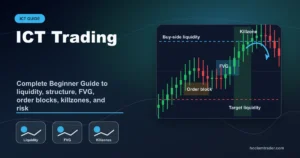
ICT Trading Concepts: Structure, Liquidity and Risk
Learn the main ICT trading concepts—liquidity, structure, displacement, FVGs and order blocks—with practical rules, limitations...
Multi-Timeframe Analysis: A Practical Top-Down Framework
Build a multi-timeframe analysis workflow with separate context, setup and entry charts, including alignment rules,...
Buy-Side vs Sell-Side Liquidity: A Practical Guide
Understand buy-side and sell-side liquidity around visible highs and lows, including sweeps, acceptance, confirmation and...

Trading Theories: Dow, Elliott, Wyckoff and Gann
Compare Dow Theory, Elliott Wave, Wyckoff, Gann and price-action frameworks by purpose, evidence, subjectivity, limitations...
Order Blocks: Identification, Validation and Limits
Learn how order blocks are identified and filtered using displacement, structure, liquidity and retests, with...

Elliott Wave Theory: Rules, 5–3 Structure and Limits
Learn Elliott Wave motive and corrective structure, three core impulse rules, alternate counts, invalidation and...
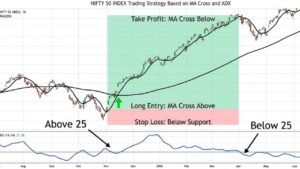
ADX Indicator: Trend Strength, DMI Signals and Filters
Learn what ADX and DMI measure, how 20 and 25 thresholds are used, and how...
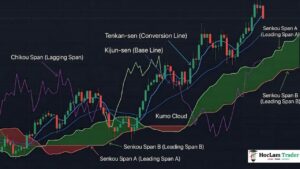
Ichimoku Cloud: Components, Signals and Strategy Limits
Understand Tenkan, Kijun, Kumo, Senkou spans and Chikou, then combine Ichimoku signals with trend context,...
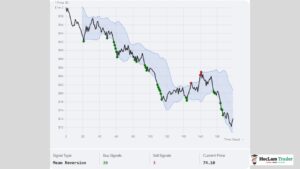
Bollinger Bands: Squeeze, Breakout and Mean Reversion
Use Bollinger Bands to measure relative volatility, distinguish squeeze, breakout and mean-reversion conditions, and define...