


bullish candlestick patterns Bullish candlestick patterns describe bars in which selling pressure weakens, price is rejected from a low or buyers close with greater control. They do not guarantee an advance and should be interpreted relative to trend, support, volatility and the following price response. The method should be treated as a testable chart-reading framework rather than a forecast. Before using it, define the market condition, confirmation event, invalidation price, transaction costs and maximum risk. This guide explains the rules, a repeatable workflow, common failure modes and the most relevant supporting concepts.
Definition
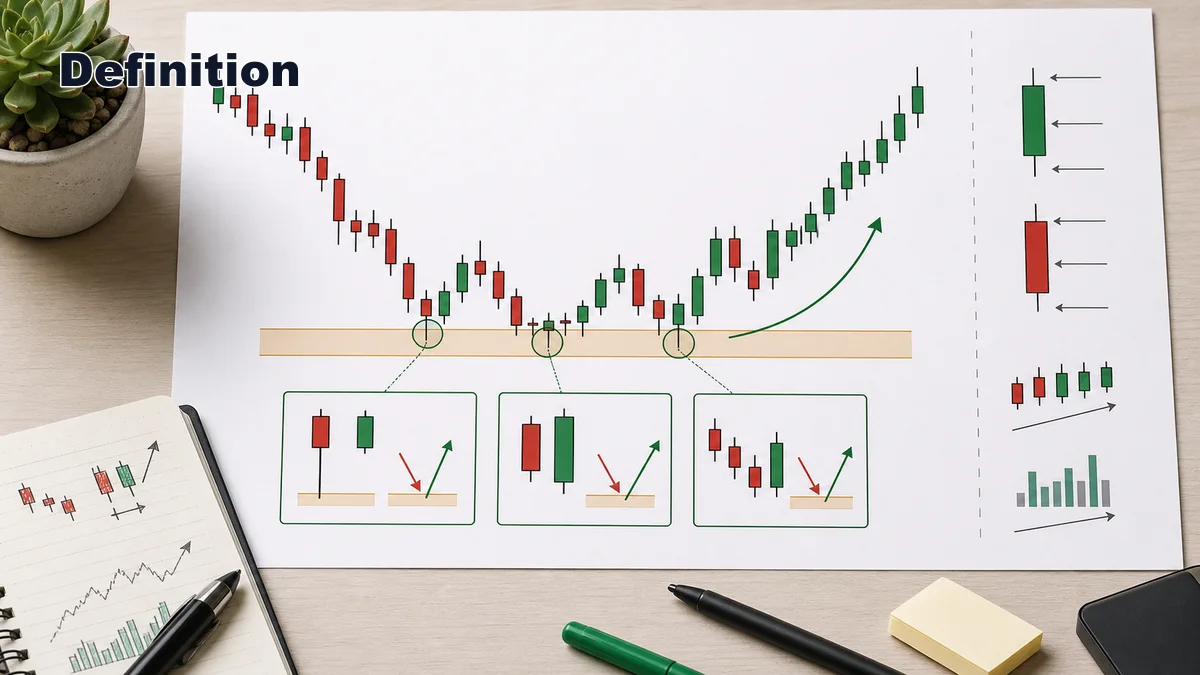
A bullish candlestick pattern is a one-candle or multi-candle formation that suggests buyers may be gaining control. It can show rejection of lower prices, a shift in momentum, exhaustion from sellers, or renewed demand after a pullback. The pattern itself does not guarantee a move higher. It simply gives traders a reason to pay attention.
The candle body shows the difference between the open and close. The upper and lower wicks show how far price traveled during the session before closing. A long lower wick can show that sellers pushed price down but buyers rejected the lower level. A large bullish body can show that buyers controlled the close. A multi-candle reversal can show that selling pressure weakened before demand returned.
The best bullish candlestick patterns are not judged only by shape. A hammer at a strong support zone after a liquidity sweep is much more meaningful than a hammer in the middle of a noisy range. A bullish engulfing candle after a controlled pullback in an uptrend is usually stronger than the same pattern inside a heavy downtrend with no support nearby.
In other words, a bullish candle pattern is a signal candidate, not a trade by itself. Context gives it meaning. Confirmation gives it strength. Risk management decides whether the setup is worth taking.
How to Identify

Start by learning the core patterns, but do not memorize them blindly. The goal is to understand what each pattern says about buyer and seller pressure.
- Hammer: a small real body near the top of the candle range with a long lower wick. It shows that sellers pushed price lower, but buyers rejected the low before the close.
- Bullish engulfing: a bearish candle followed by a larger bullish candle that engulfs the prior body. It shows a clear shift from selling pressure to buying pressure.
- Morning star: a three-candle reversal pattern with a strong bearish candle, a small indecision candle, and a strong bullish candle. It shows a transition from seller control to buyer control.
- Piercing line: a bearish candle followed by a bullish candle that opens lower and closes above the midpoint of the prior bearish body.
- Tweezer bottom: two or more candles rejecting a similar low, showing that sellers failed to push through the same area.
- Bullish harami: a small bullish or indecision candle forming inside the body of a larger bearish candle, suggesting selling pressure may be slowing.
- Bullish marubozu: a strong bullish candle with little or no wick, showing decisive demand during that session.
After recognizing the shape, check the location. Ask whether the pattern appears at support, near a moving average, after a pullback, after a liquidity sweep, or at a higher-timeframe demand zone. A bullish pattern floating in the middle of nowhere has much less value.
Finally, check what happened before the pattern. A hammer after an extended drop can signal rejection, but it may also be a temporary pause in a strong downtrend. A bullish engulfing candle after several weak candles into support is usually cleaner than one that appears after a vertical rally has already happened.
Why It Works
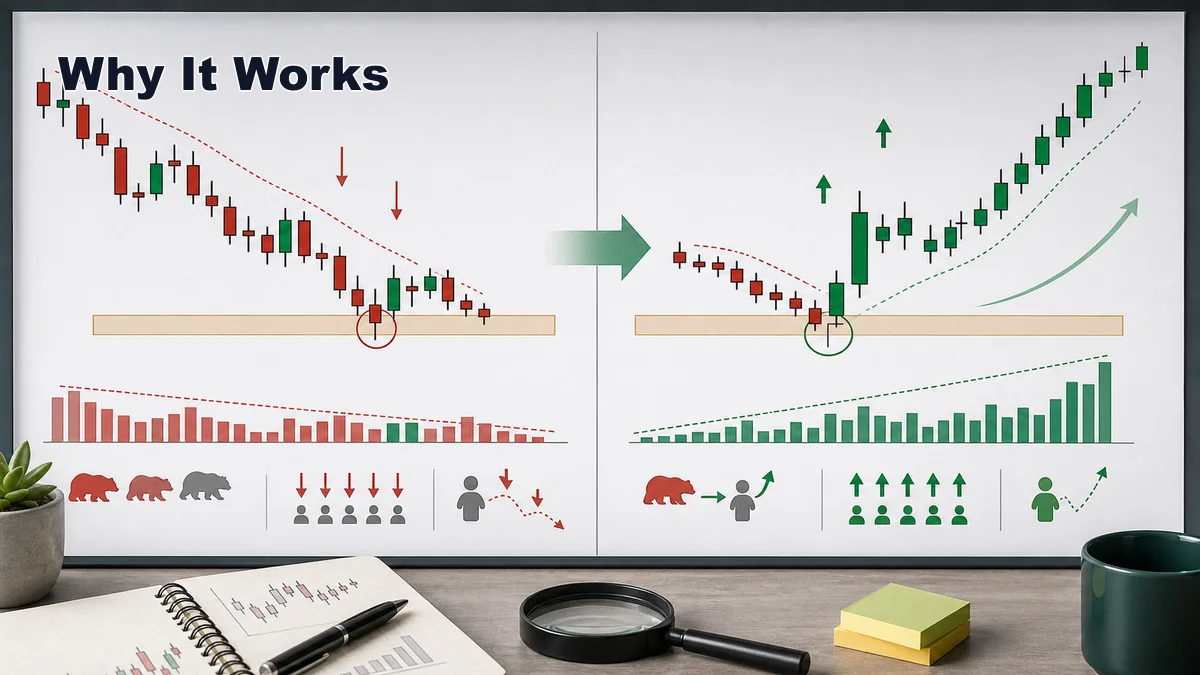
Bullish candlestick patterns work because they compress market psychology into a simple visual form. A long lower wick tells a story: sellers had control during part of the session, but buyers stepped in strongly enough to push price back up. A bullish engulfing candle tells another story: the market opened with bearish pressure, then buyers overwhelmed it and closed above the prior candle body.
These patterns can also create order-flow effects. Short sellers who entered late may cover if price reverses strongly. Traders waiting for confirmation may enter after the pattern high breaks. Buyers who missed the first reaction may wait for a retest. This combination can create follow-through, especially when the pattern forms at a level many traders are watching.
However, the reason a pattern works is also the reason it can fail. If there is no meaningful level, no higher-timeframe support, no volume change, no structure shift, or no follow-through, the pattern may simply be noise. A single bullish candle cannot overcome a strong bearish trend by itself.
The best use of bullish candlestick patterns is to read them as evidence. One candle may show rejection. The next candle may confirm momentum. A support zone may provide context. A stop-loss level may define risk. When these pieces align, the pattern becomes part of a trade plan instead of a random signal.
Step-by-Step Usage
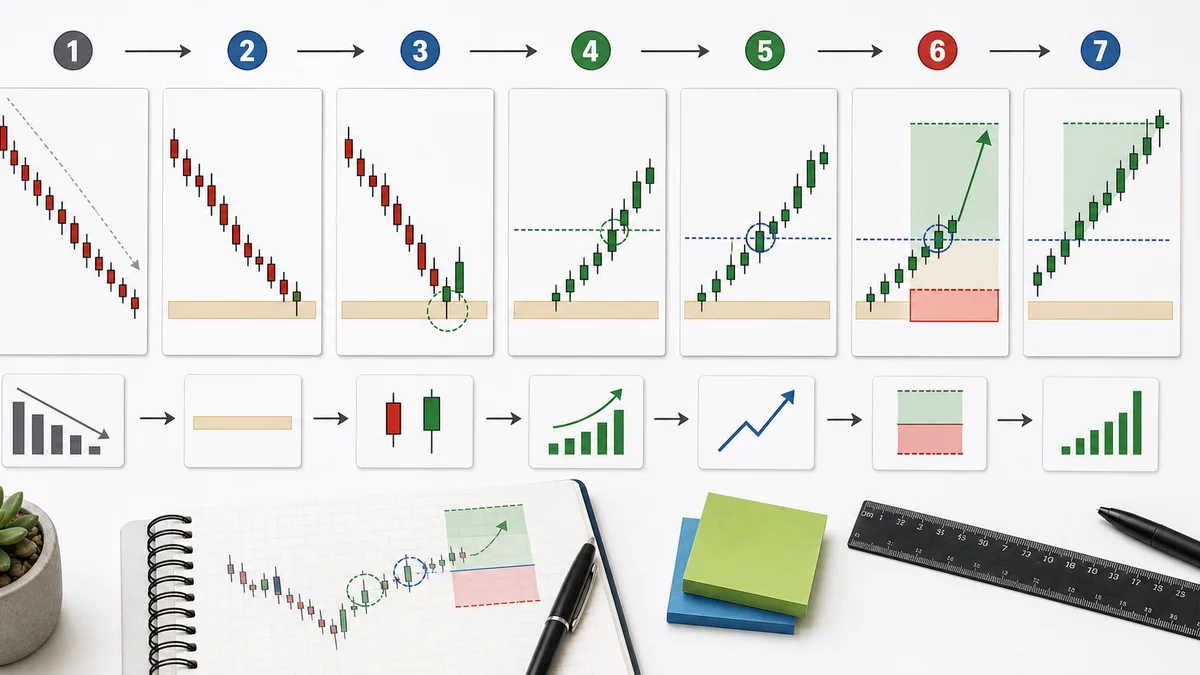
- Define the market context. Decide whether price is trending, ranging, pulling back, or reversing from a major area.
- Mark important levels. Identify support, resistance, demand zones, moving averages, trendlines, or prior swing lows before looking for the candle pattern.
- Wait for the pattern to close. Do not enter while the candle is still forming. A strong-looking bullish candle can turn into a rejection wick before the close.
- Check the pattern quality. Look at the body size, wick length, relationship to the prior candle, and whether the pattern clearly shows buyer response.
- Seek confirmation. Wait for price to break the pattern high, hold a retest, print a higher low, or show increased volume.
- Plan entry and invalidation. Common invalidation is below the pattern low, below the support zone, or below the sweep low, depending on the setup.
- Choose realistic targets. Use nearby resistance, liquidity, previous swing highs, or measured risk-to-reward instead of assuming a huge reversal.
- Review the setup later. Save screenshots of good patterns, failed patterns, and skipped trades so your pattern reading improves over time.
This workflow matters because bullish patterns can appear everywhere. The trader’s job is not to take all of them. The job is to filter for the ones that appear at meaningful locations with a clear risk plan.
Confirmation Rules
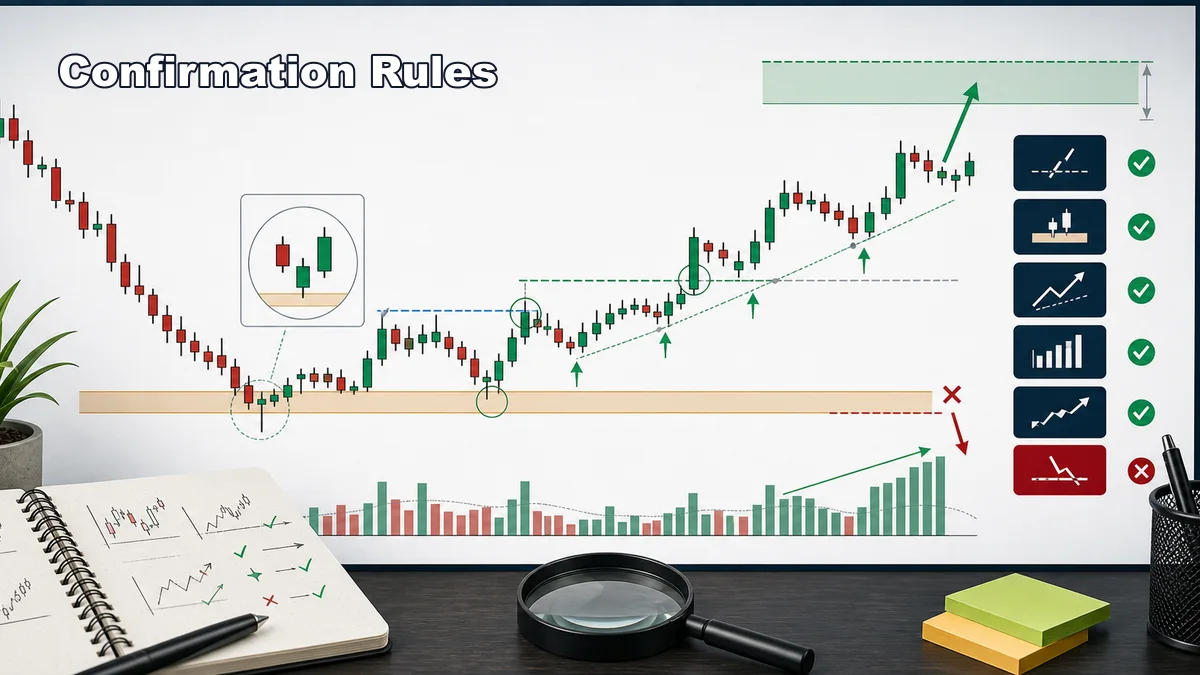
- Location first: the pattern should form at a meaningful level, not in the middle of random price movement.
- Candle close: wait for the candle or full pattern to close before treating it as valid.
- Break of pattern high: price moving above the high of the bullish pattern can confirm short-term momentum.
- Support reaction: the pattern is stronger when it rejects a clear support or demand area.
- Volume support: higher volume on the bullish candle can show stronger participation, especially after a sell-off.
- Structure shift: a higher low, break of minor resistance, or change of character can support the bullish case.
- Defined invalidation: if price breaks below the pattern low or support zone, the trade thesis should be questioned.
Confirmation does not remove risk. It simply improves the quality of the signal. Sometimes the best choice is to skip a pattern because confirmation arrives too late or the stop would be too wide.
Examples
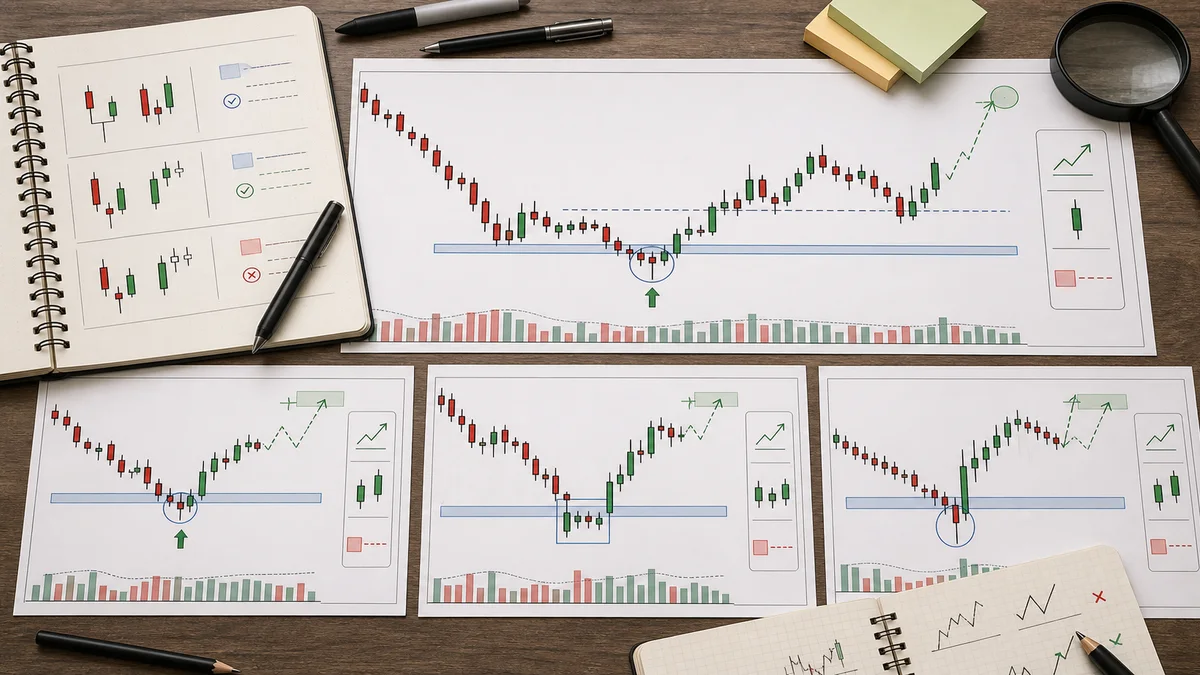
Example one: price is in an uptrend and pulls back toward a prior support zone. The pullback slows, then a hammer forms with a long lower wick that rejects the zone. The next candle trades above the hammer high. This setup is not bullish because the hammer exists. It is bullish because the pattern forms at support, after a pullback, and then confirms with follow-through.
Example two: a market has sold off for several sessions and reaches a higher-timeframe demand area. A bearish candle forms first. The next candle opens slightly lower, then rallies and closes above the body of the prior candle, forming a bullish engulfing pattern. If volume expands and price breaks minor resistance, traders may treat it as a potential reversal attempt.
Example three: after a strong decline, a long bearish candle appears, followed by a small indecision candle, then a strong bullish candle that closes deeply into the first candle’s body. This morning star pattern shows a three-step transition: seller control, hesitation, and buyer response. It becomes more useful if it forms at support and price later holds a higher low.
Example four: price breaks slightly below a previous swing low and quickly returns above it, forming a long lower wick. If the next candle engulfs the prior bearish candle, the setup combines a liquidity sweep with a bullish engulfing pattern. This can be powerful, but it still needs a stop below the sweep low or another clear invalidation point.
Common Mistakes
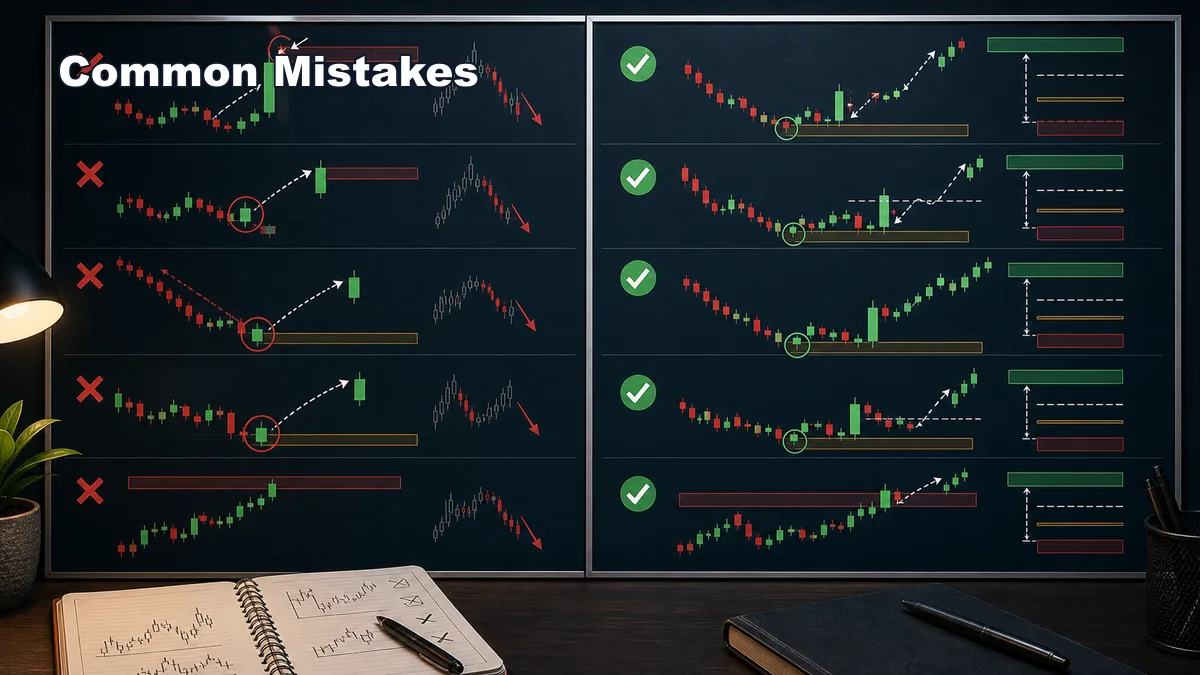
- Trading patterns in the middle of nowhere: a bullish candle with no nearby level, structure, or context is usually weak.
- Entering before the close: an unfinished candle can change completely before the session ends.
- Ignoring the trend: a bullish candle against a strong downtrend needs much more confirmation than one after a pullback in an uptrend.
- Using no stop loss: every pattern needs an invalidation point. A failed bullish pattern can lead to fast downside movement.
- Chasing after a huge candle: a strong bullish candle may confirm demand, but entering too late can create poor risk-to-reward.
- Forgetting resistance: a bullish pattern directly below major resistance may have limited upside room.
- Memorizing names only: the psychology behind the candle matters more than whether the pattern matches a textbook drawing perfectly.
Bullish candlestick patterns are most useful when they simplify decision-making. They show where buyers may be responding, but they still need context, confirmation, and risk control. Continue the learning path through the Price Action hub, the Candlesticks category, and the Candlestick Patterns complete guide.
The practical goal is not to predict every reversal. The goal is to recognize when selling pressure is weakening, buyers are responding from a meaningful area, and the chart offers a clean plan with confirmation and invalidation.
Key takeaways
- Bullish candlestick patterns describe bars in which selling pressure weakens, price is rejected from a low or buyers close with greater control.
- They do not guarantee an advance and should be interpreted relative to trend, support, volatility and the following price response.
- Require a meaningful location and define whether confirmation is a close, a break or a retest before entering.
- A valid plan separates location, trigger, invalidation, position size and exit logic.
A validation workflow you can reproduce
- Define the sample: choose the market, timeframe, session and date range before reviewing outcomes.
- Write the rule: Require a meaningful location and define whether confirmation is a close, a break or a retest before entering.
- Record invalidation: identify the observable price event that disproves the setup.
- Include execution costs: account for spread, commission and slippage where relevant.
- Validate separately: test the finished rule on data that was not used to create it.
When this concept is unreliable
Bullish patterns are unreliable when they form in the middle of noise, directly below resistance or without room relative to invalidation. Keep failed and skipped examples in the journal so the review is not limited to attractive winners.
Use this concept within a complete analysis
This method should remain connected to its parent framework and adjacent decision steps. Use How to Read Candlesticks in Forex and Crypto, Chart Patterns: Complete Guide for Traders, Classic Chart Patterns Cheat Sheet, Price Action Trading: Structure, Setups and Risk, Market Structure: Complete Guide for Traders and Multi-Timeframe Analysis: Complete Guide to compare definitions, establish context and avoid treating one signal as a complete trading system.
References and methodology
- CME Group — Technical Analysis
- CFTC — Eight Things to Know Before Trading Forex
- CME Group — Chart Types: Candlestick, Line and Bar
- CME Group — Technical Patterns: Reversals
Practise before considering real capital
Use historical charts or a demo account to test the written rules before considering live execution. Review the Exness account and demo information. Availability, protections and trading conditions depend on jurisdiction, so review the applicable legal documents yourself.
Affiliate disclosure: Học Làm Trader may receive a commission if you open an account through this link, at no additional cost to you. This relationship does not determine the educational conclusions.
Risk warning: This article is for education and general information only. It is not investment advice, a trade signal or an invitation to trade. Trading can result in loss of capital, and past examples do not guarantee future results. Assess your own circumstances and risk tolerance.
For the opposite side of the comparison, review bearish candlestick patterns and their failure conditions.