


Wyckoff accumulation Wyckoff accumulation is a hypothesis that a trading range may precede an upward markup after selling pressure is absorbed. Labels such as selling climax, spring and sign of strength describe candidate events; they do not prove that a Composite Operator is accumulating. The method should be treated as a testable chart-reading framework rather than a forecast. Before using it, define the market condition, confirmation event, invalidation price, transaction costs and maximum risk. This guide explains the rules, a repeatable workflow, common failure modes and the most relevant supporting concepts.
Definition
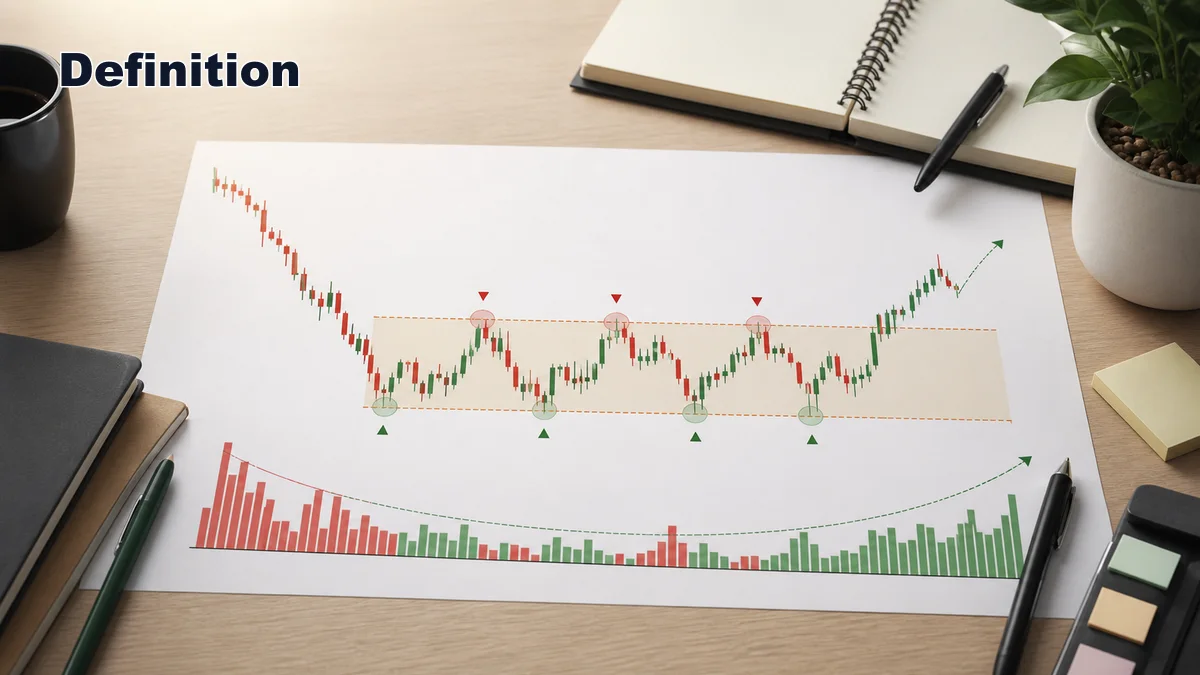
Wyckoff accumulation is a sideways market structure that may form after a sustained decline. It represents a period where large interests, often described in Wyckoff terms as the Composite Operator, may be accumulating positions without pushing price aggressively higher too early.
The idea is built on supply and demand. After a downtrend, many traders are fearful, late sellers are active, and discouraged holders may be ready to exit. Stronger hands can use that selling pressure as liquidity. They do not need the market to rally immediately. They need time to absorb supply at favorable prices.
A complete Wyckoff accumulation schematic is often described through phases A to E. Phase A stops the prior downtrend. Phase B builds the cause inside the range. Phase C tests the remaining supply, often through a spring. Phase D shows stronger demand through a sign of strength and last point of support. Phase E is the markup phase, where price leaves the range and begins trending higher.
The important point is that accumulation is not just “price moving sideways.” A clean Wyckoff accumulation should show a battle between remaining sellers and improving demand. Traders study the range, volume, failed breakdowns, reactions from support, breakouts from resistance, and pullbacks after strength.
How to Identify

Start with the context before naming the pattern. Wyckoff accumulation is most meaningful after a clear decline or bearish campaign. If price is already in a strong uptrend, the structure may be reaccumulation rather than base accumulation. If price has no clear prior downtrend, the range may simply be consolidation.
Next, mark the range. A potential accumulation area usually begins with a Selling Climax, where price falls sharply and volume expands. The Automatic Rally then shows the first strong reaction from buyers. Together, the low of the Selling Climax and the high of the Automatic Rally help define the early trading range.
After that, watch the Secondary Test. A healthy test revisits the lower part of the range with less downside pressure than the original climax. It does not need to be perfect, but the key question is whether sellers can create new downside progress. If the market keeps making lower lows with heavy volume and no recovery, accumulation is not confirmed.
As Phase B develops, price may move back and forth between support and resistance. Volume often becomes less extreme, volatility may narrow, and the range starts building a cause. This is the frustrating part. Many traders get chopped up because they try to trade every small swing instead of waiting for clearer evidence.
A spring is one of the best-known Wyckoff events. It occurs when price briefly moves below range support, triggers stops or attracts late shorts, then quickly returns back into the range. A spring is not valid just because price dips below support. The reaction after the dip matters. If price cannot reclaim the range, the move may be a real breakdown.
Why It Works
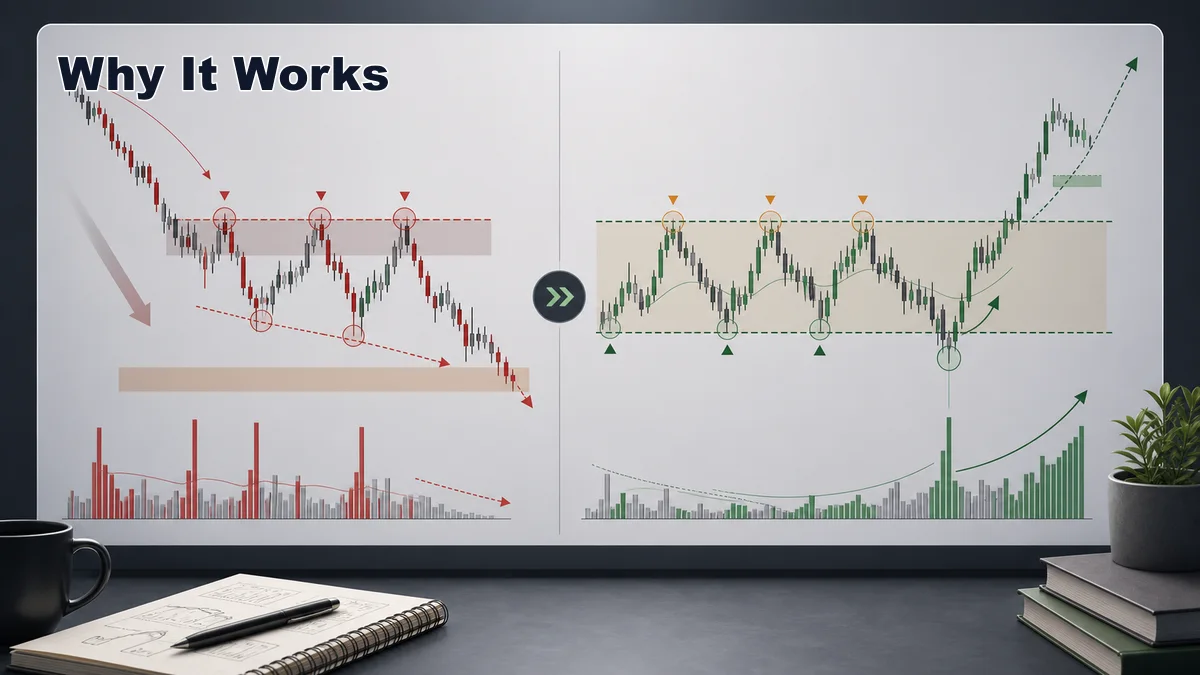
Wyckoff accumulation works because it models a practical market problem: large positions usually cannot be built all at once. If a large participant buys too aggressively, price may move away before the position is complete. A range allows buying to happen gradually while public selling, stop-loss activity, and short interest provide liquidity.
The method also works because it studies behavior instead of relying only on indicators. A range low that is tested several times without meaningful downside progress can suggest that sellers are losing power. A spring that quickly recovers can show that the market rejected lower prices. A strong rally through resistance can show that demand is finally able to move price.
The law of cause and effect is central to Wyckoff thinking. The longer and cleaner the base, the larger the potential cause being built. That does not mean a long range must lead to a huge rally. It means the range gives traders a structure for measuring potential, planning invalidation, and waiting for confirmation.
Wyckoff also helps traders avoid emotional bottom-picking. Instead of buying just because price looks cheap, the trader waits for evidence that supply has been tested and demand is improving. This shift from prediction to confirmation is what makes the model useful.
Step-by-Step Usage
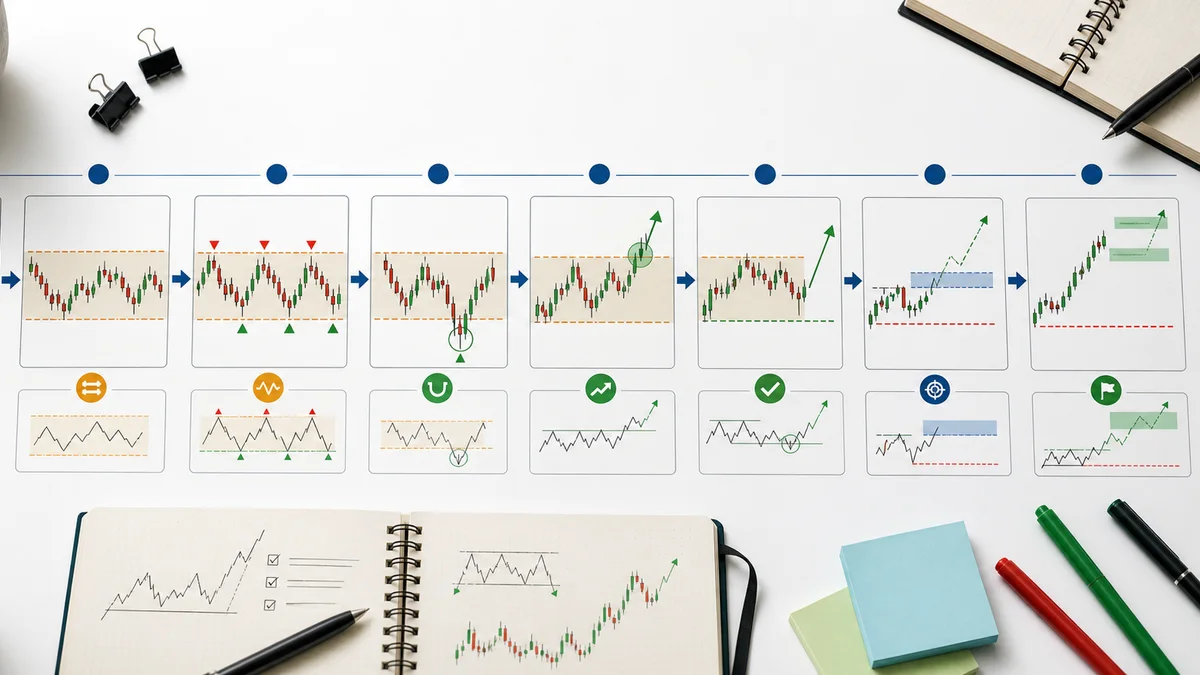
- Find the prior downtrend. Accumulation has more meaning when it appears after clear selling pressure, not in the middle of random sideways movement.
- Mark the range boundaries. Use the Selling Climax low and Automatic Rally high as early reference points, then adjust only if the market proves a cleaner boundary.
- Watch the tests. Secondary Tests and later support reactions should show whether supply is still dominant or beginning to dry up.
- Separate Phase B from trade entry. Phase B can last a long time. It is usually better for observation and mapping than aggressive trading.
- Study the spring or shakeout. If price sweeps below support and quickly reclaims the range, the market may be testing the last supply.
- Wait for strength. A Sign of Strength should show decisive upward progress, not a weak candle that barely breaks resistance.
- Plan the Last Point of Support. After strength, a controlled pullback on lighter selling pressure can offer a cleaner risk location.
- Define invalidation. A trade idea needs a level where the accumulation thesis is wrong, such as failure to reclaim the range or a breakdown after weak demand.
For many traders, the best practical entries come after a spring recovery or after a Sign of Strength followed by a Last Point of Support. The first approach is earlier and usually riskier. The second approach is later but often has more confirmation.
Confirmation Rules
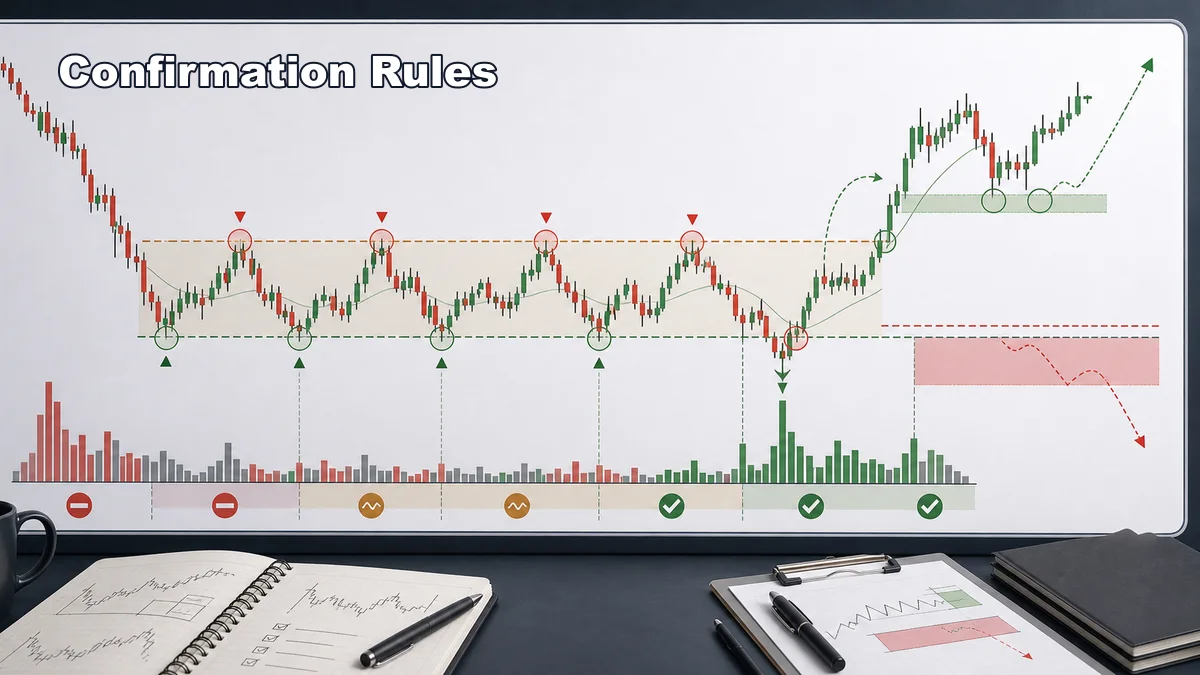
Confirmation is essential because many ranges that look like accumulation eventually break lower. The goal is not to prove that smart money is definitely buying. The goal is to gather enough evidence that demand is improving and supply is failing to create downside progress.
- Range clarity: the trading range should have recognizable support and resistance, not random overlapping candles.
- Reduced downside result: later tests of support should produce less downside progress than the original selling climax.
- Spring recovery: if a spring occurs, price should reclaim the range quickly and show strong follow-through.
- Volume logic: high volume with no downside progress can suggest absorption, while a breakout with expanding demand can support the markup thesis.
- Sign of Strength: price should push through range resistance with conviction, not only wick above it and fall back immediately.
- Last Point of Support: after strength, the pullback should hold above key support with weaker selling pressure.
- Invalidation: if price breaks down and cannot reclaim the range, the accumulation idea should be questioned.
Do not require every textbook label to appear. Real charts are rarely perfect. A practical Wyckoff read focuses on behavior: failed selling, improving demand, accepted strength, and defined risk.
Examples
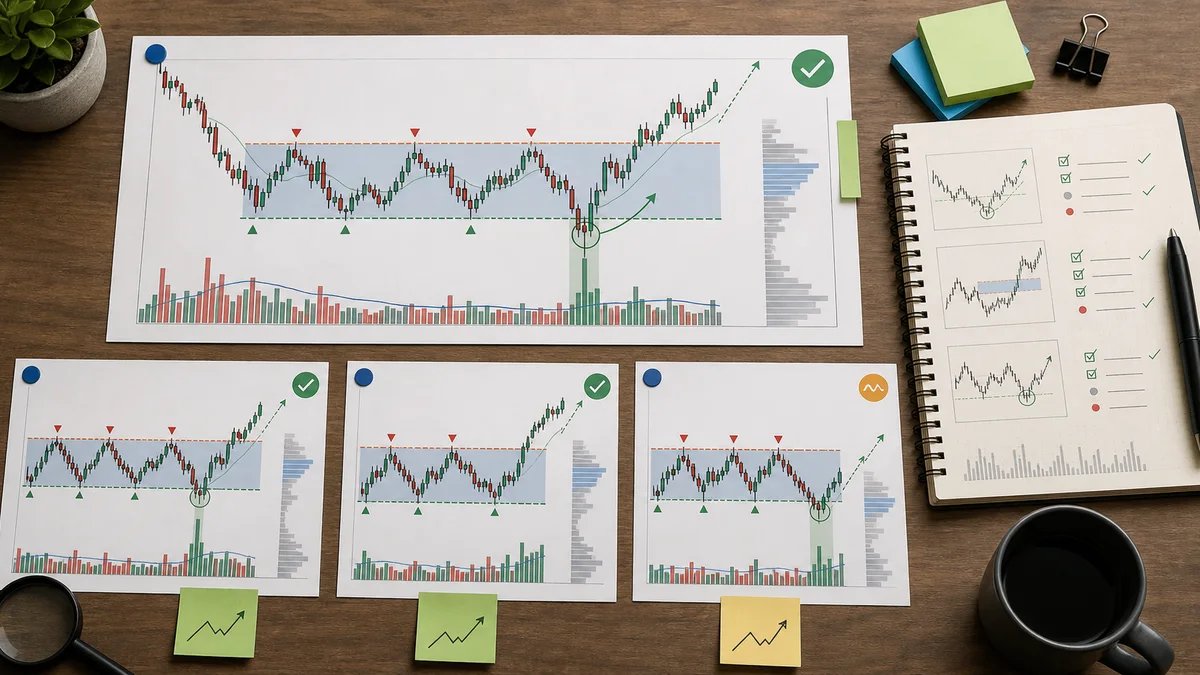
Imagine a market that has been trending lower for several weeks. The final sell-off creates a large bearish candle and unusually high volume. Instead of continuing lower, price rebounds sharply. That reaction creates the Automatic Rally. A few sessions later, price tests the low again but selling pressure is weaker and the market holds. This begins the possible accumulation range.
During Phase B, price may frustrate both sides. Breakout buyers get rejected near the range high, and breakdown sellers fail near the range low. Volume becomes less dramatic. The market is not ready yet, but the repeated inability to continue lower becomes useful information.
Later, price dips below the range low, triggers stops, and pulls in late shorts. If the market quickly closes back inside the range and follows with strong bullish candles, that move may act as a spring. A trader may then watch for a higher low, a break of internal structure, or a move toward the range high.
A more conservative example appears after the Sign of Strength. Price breaks above the range high with wide spread and strong participation. Instead of chasing the breakout, the trader waits for a pullback. If the pullback holds above the old resistance or an internal support area, that Last Point of Support can provide a more controlled entry plan.
These examples can appear in stocks, crypto, forex, commodities, and indexes, but the principle is the same: context first, range second, confirmation third, risk always.
Common Mistakes
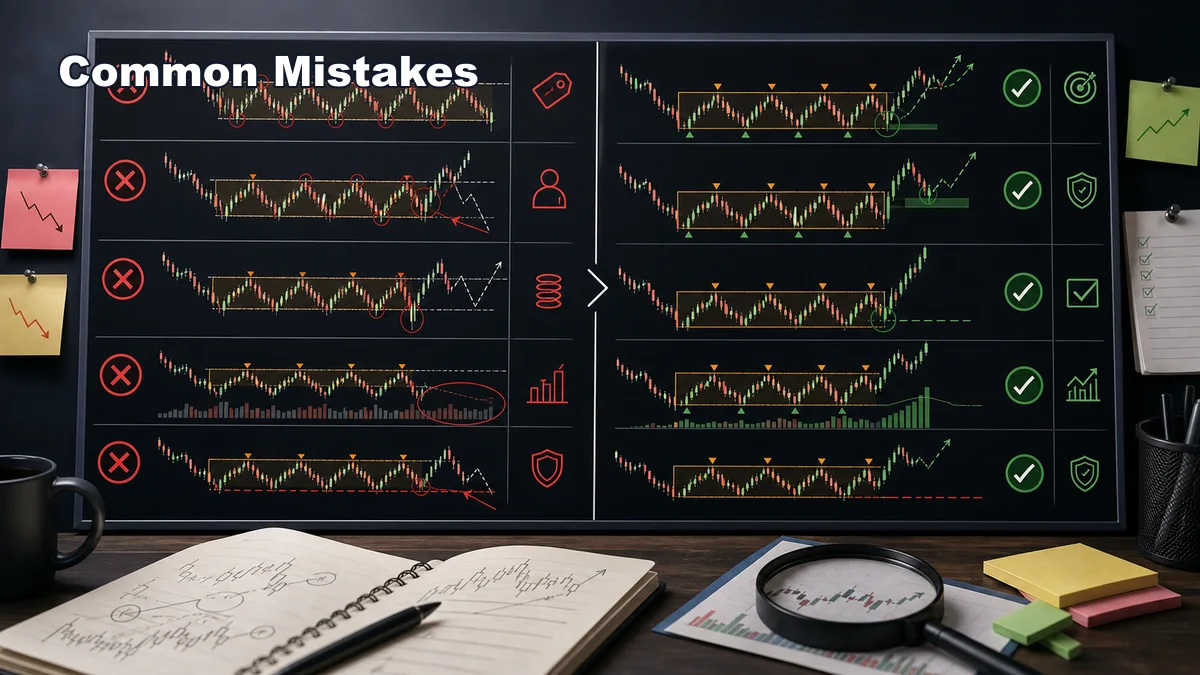
- Calling every range accumulation: a sideways market after a decline is only a candidate. It still needs evidence of absorption and improving demand.
- Buying Phase B too aggressively: Phase B can be long and noisy. Traders who enter every support touch often get chopped up.
- Misreading a breakdown as a spring: a spring should recover. If price breaks support and stays below it, the bearish case may be stronger.
- Ignoring volume behavior: Wyckoff is price plus volume. A breakout with weak participation deserves caution.
- Forcing exact labels: real markets do not always print a perfect PS, SC, AR, ST, spring, SOS, and LPS sequence.
- Entering without invalidation: even a beautiful schematic can fail. A plan without a stop or invalidation point is not a plan.
- Expecting immediate markup: accumulation can take time. A strong range may still need several tests before a sustainable move appears.
Wyckoff accumulation is most valuable when it keeps you patient. It gives you a way to study whether supply is being absorbed, where confirmation may appear, and where the idea would be wrong. Read it alongside the THEORIES hub, the Wyckoff category, and the Trading Theories complete guide so the concept fits into a broader technical analysis learning path.
The best use of Wyckoff accumulation is not to predict bottoms. It is to wait for a market to show that selling pressure is weakening, demand is improving, and risk can be defined before the markup phase becomes obvious to everyone else.
Key takeaways
- Wyckoff accumulation is a hypothesis that a trading range may precede an upward markup after selling pressure is absorbed.
- Labels such as selling climax, spring and sign of strength describe candidate events; they do not prove that a Composite Operator is accumulating.
- Define the range and alternative distribution or reaccumulation scenarios before assigning later-phase labels.
- A valid plan separates location, trigger, invalidation, position size and exit logic.
A validation workflow you can reproduce
- Define the sample: choose the market, timeframe, session and date range before reviewing outcomes.
- Write the rule: Define the range and alternative distribution or reaccumulation scenarios before assigning later-phase labels.
- Record invalidation: identify the observable price event that disproves the setup.
- Include execution costs: account for spread, commission and slippage where relevant.
- Validate separately: test the finished rule on data that was not used to create it.
When this concept is unreliable
Accumulation analysis is unreliable when every spring is identified only after markup or volume evidence is interpreted differently for each example. Keep failed and skipped examples in the journal so the review is not limited to attractive winners.
Use this concept within a complete analysis
This method should remain connected to its parent framework and adjacent decision steps. Use Elliott Wave Impulse Waves Explained, Elliott Wave Theory: Rules, 5–3 Structure and Limits, Gann Theory: Complete Beginner Guide, Wyckoff Method: Complete Beginner Guide, Gann Fan Trading Strategy Explained and Price Action Trading: Structure, Setups and Risk to compare definitions, establish context and avoid treating one signal as a complete trading system.
References and methodology
Practise before considering real capital
Use historical charts or a demo account to test the written rules before considering live execution. Review the Exness account and demo information. Availability, protections and trading conditions depend on jurisdiction, so review the applicable legal documents yourself.
Affiliate disclosure: Học Làm Trader may receive a commission if you open an account through this link, at no additional cost to you. This relationship does not determine the educational conclusions.
Risk warning: This article is for education and general information only. It is not investment advice, a trade signal or an invitation to trade. Trading can result in loss of capital, and past examples do not guarantee future results. Assess your own circumstances and risk tolerance.
Compare this sequence with Wyckoff distribution phases and events; the two ranges require different evidence and invalidation.