


MSNR rejection candle is a candlestick reaction that shows price tried to move through a support or resistance zone, failed to hold there, and closed in a way that suggests the zone may still matter. The key word is “may.” A rejection candle is not a guaranteed bounce. It is evidence that must be read with location, market context, candle close, invalidation, and stop-loss logic.
This guide helps beginner to intermediate retail traders separate a real bounce from a fake one. The promise is objective candle behavior: where the rejection forms, how the wick and body behave, whether price closes back inside the zone, and whether the next candle confirms or cancels the idea.
For the full framework, read the complete MSNR trading strategy guide. You can also connect this lesson with MSNR candlestick confirmation, support and resistance drawing mistakes, and SNR level invalidation.
Trading involves risk. This article is educational only and is not financial advice, investment advice, or a signal to buy or sell any market. Stop orders and market orders can have execution risks in fast markets, so study order behavior before relying on any stop-loss method. Investor.gov’s order type guide explains market, limit, and stop-loss orders, and FINRA’s stop-order guidance explains why stop execution can differ from the stop price during volatility. Always define invalidation, use responsible position sizing, and test rules in your own market conditions.
Author and review note: Written by the HocLamTrader Editorial Team for educational chart study. Updated May 21, 2026. Examples are conceptual, not live trade recommendations, and should be forward tested with your own timeframe, spread, volatility, session, and execution conditions.
What MSNR Rejection Candle Means in MSNR
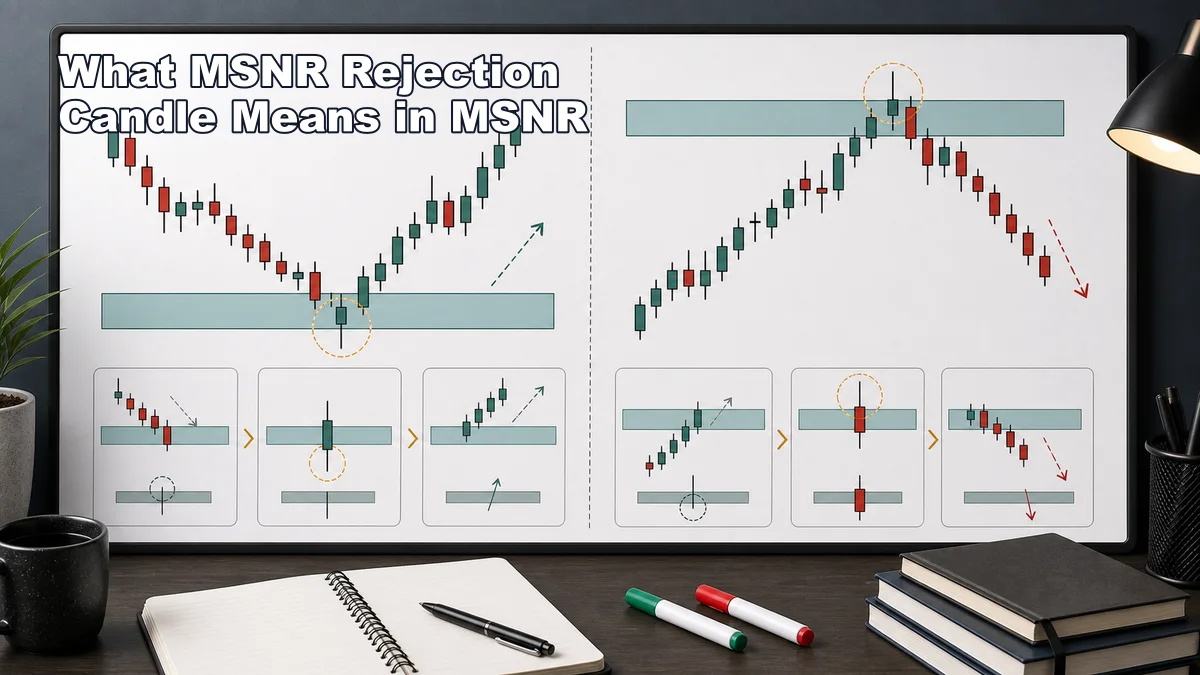
In MSNR, a rejection candle appears when price tests a support or resistance zone and fails to stay beyond it. At support, price may push below the zone, create a lower wick, and close back above or inside the zone. At resistance, price may push above the zone, create an upper wick, and close back below or inside the zone.
The wick is important because it shows an attempted move. The close is important because it shows where price finished after that attempt. A long lower wick at support means sellers pushed down, but buyers may have responded before the candle closed. A long upper wick at resistance means buyers pushed up, but sellers may have responded before the candle closed.
However, wick size alone is not enough. A candle with a dramatic wick can still be fake if it forms in the middle of noise, directly into higher-timeframe pressure, or after price has already invalidated the zone. A real MSNR rejection should happen at a meaningful support or resistance area, not at a random candle tail.
A useful rejection candle has four parts: a clean zone, an attempted break, a close that rejects the attempt, and a logical invalidation point. If one part is missing, the trade idea becomes weaker. If all four are present, the trader still needs to check risk and the next obstacle before entering.
For example, a support rejection may look promising when price sweeps below support and closes back above it. But if the next resistance is very close, the trade may not have enough room. A resistance rejection may look strong when price wicks above a zone and closes lower. But if the broader trend is strongly bullish, the trader may need extra confirmation before shorting.
Why It Matters Before Taking a Trade
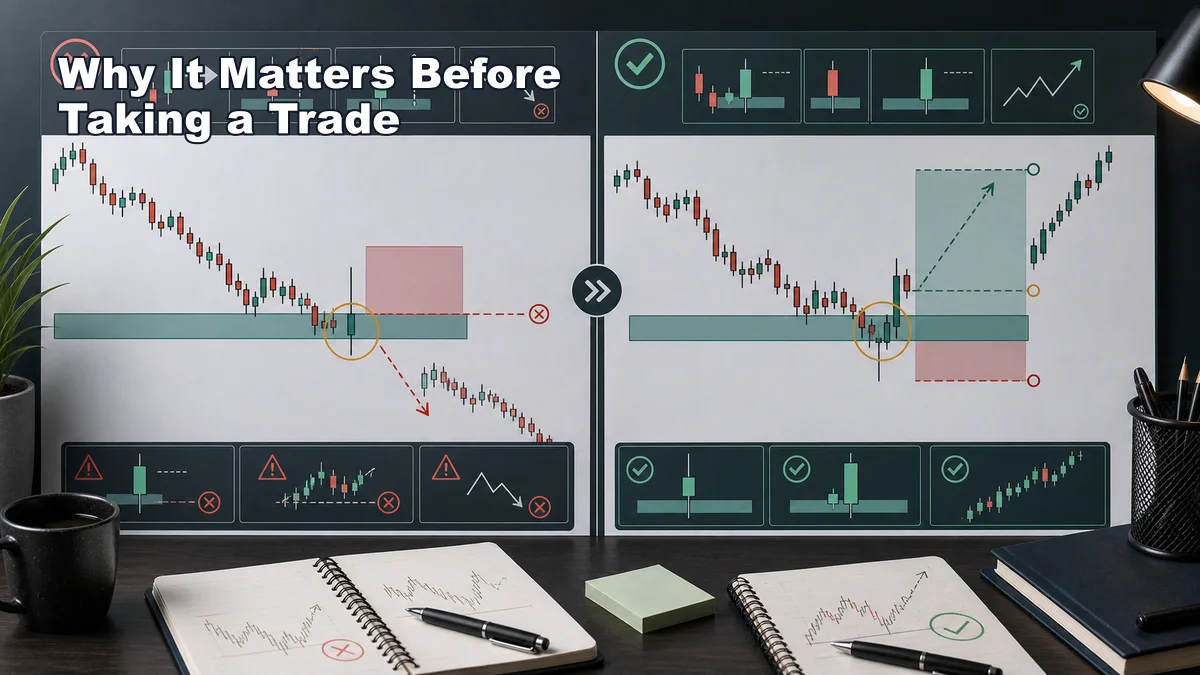
A rejection candle matters before taking a trade because support and resistance zones are not automatic entry signals. A zone tells you where to watch. A rejection candle starts to tell you how price is behaving at that location.
Without rejection evidence, a trader may enter only because price touched support or resistance. That can lead to early entries, weak stops, and emotional exits. With rejection evidence, the trader can ask better questions: Did price fail beyond the zone? Did it close back inside? Did the next candle support the reaction? Is invalidation clear?
The real value is not prediction. The value is structure. A rejection candle can give the trader a specific reference point. For a long setup, the rejection low may help define where buyers failed. For a short setup, the rejection high may help define where sellers failed. This makes stop-loss planning less random.
Rejection candles also help filter fake bounces. A fake bounce often has weak follow-through, forms at a poor level, or appears after the zone has been chopped through many times. A real bounce is more likely when rejection appears at a clean zone, aligns with higher-timeframe context, closes with intent, and has room to the next target.
Still, a rejection candle can fail. A strong market can wick through resistance, close lower, and then break higher on the next candle. A support rejection can attract buyers, then fail if sellers return with stronger pressure. This is why rejection should never remove risk control. It should only help define the plan.
Step-by-Step Chart-Reading Workflow
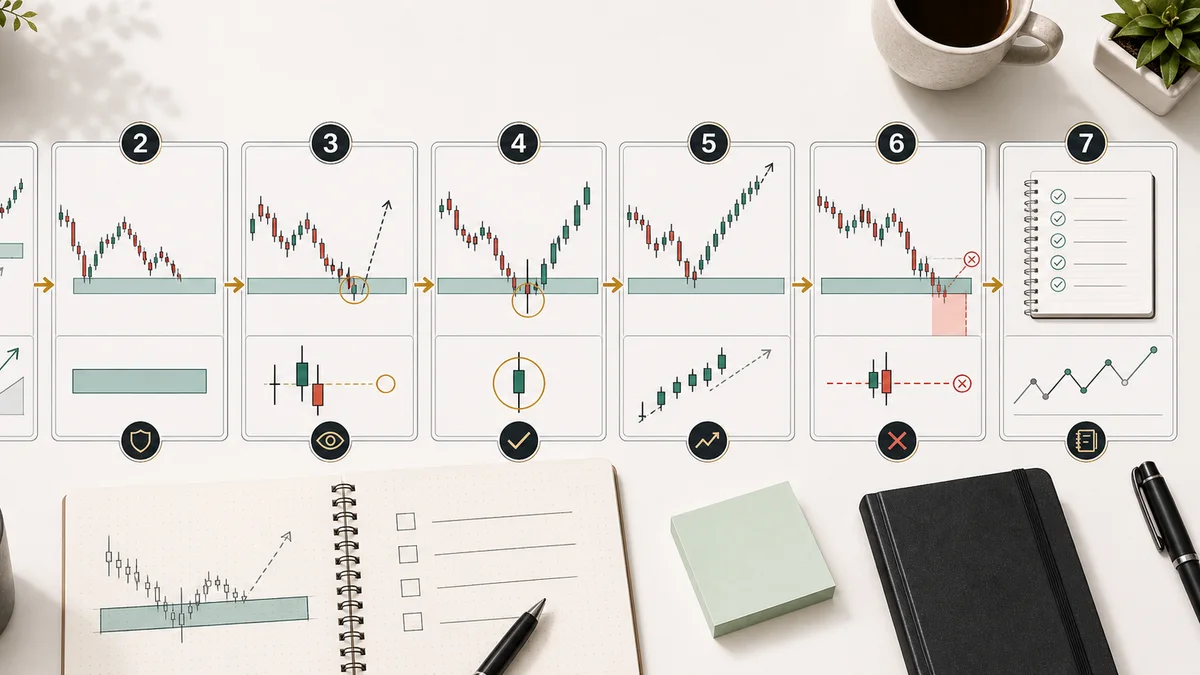
Use this workflow when reading an MSNR rejection candle. The goal is to decide whether the bounce is tradable, needs more evidence, or should be skipped.
- Start with the higher timeframe. Identify whether the market is trending, ranging, or approaching a major obstacle. Rejection against a strong higher-timeframe move needs more caution.
- Mark the clean SNR zone. Use obvious support and resistance zones from major swings, range boundaries, or previous strong reactions. Avoid random small pivots.
- Wait for price to reach the zone. A rejection candle away from a meaningful level is usually less useful for MSNR execution.
- Read the attempt. Did price push through the zone, sweep liquidity, or test the edge of the zone? A rejection should show that price tried something first.
- Read the close. Did the candle close back above support, back below resistance, or near the wrong side of the zone? The close helps separate rejection from acceptance.
- Check follow-through. Some traders wait for the next candle, a small structure shift, or a retest. Choose one rule and test it instead of changing rules after the result.
- Define invalidation. Decide whether the setup fails beyond the wick, beyond the zone, or after a close on the other side.
- Check reward-to-risk. If the rejection candle is too large or the next opposing zone is too close, the trade may not be worth taking.
This workflow is especially useful when the candle looks dramatic. Big wicks can attract attention, but the best question is still practical: can this candle help define a clean trade with controlled risk?
In your journal, record whether the rejection was a support rejection, resistance rejection, liquidity sweep, failed close, or no trade. After enough examples, you can learn which rejection behaviors actually improve your MSNR results.
Entry, Invalidation and Stop-Loss Logic
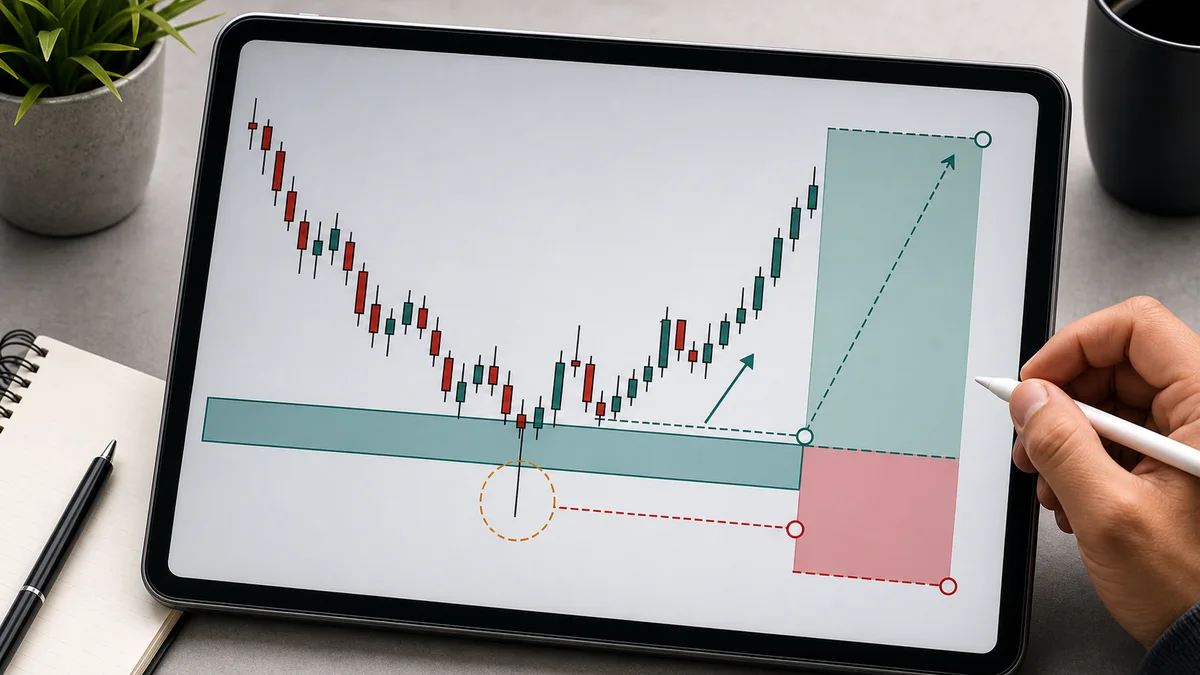
A rejection candle entry can be built in several ways. The simplest version is to enter after the rejection candle closes. This gives more information than entering while the candle is still forming, but it may enter farther away from the zone. Another version waits for a small pullback after the close. A third version waits for the next candle to break the rejection candle’s high or low in the expected direction.
For a long trade from support, the entry idea might be: price tests support, rejects lower prices, closes back above the zone, and the next candle shows buyer follow-through. Invalidation may be below the rejection wick, below the support zone, or below a lower-timeframe swing that formed during the reaction.
For a short trade from resistance, the entry idea might be: price tests resistance, rejects higher prices, closes back below the zone, and the next candle shows seller follow-through. Invalidation may be above the rejection wick, above the resistance zone, or above the lower-timeframe reaction high.
The stop loss should sit around the point where the rejection idea is wrong. A stop inside the wick may be too tight if normal noise can retest the area. A stop far beyond the zone may be too wide if it damages reward-to-risk. If no logical stop fits your risk limit, the correct action is to reduce position size or skip the trade.
Targets should come from structure, not hope. A long setup may target the next resistance zone, prior swing high, or range high. A short setup may target the next support zone, prior swing low, or range low. If the next target is too close, a clean rejection candle can still be a bad trade.
The key is consistency. If your rule says the rejection candle must close back inside the zone, do not accept a candle that only wicks and closes weakly because you like the direction. If your rule says the next candle must confirm, do not enter before it because you fear missing the move. A tested rule is more useful than a perfect-looking candle.
Common Mistakes and Checklist
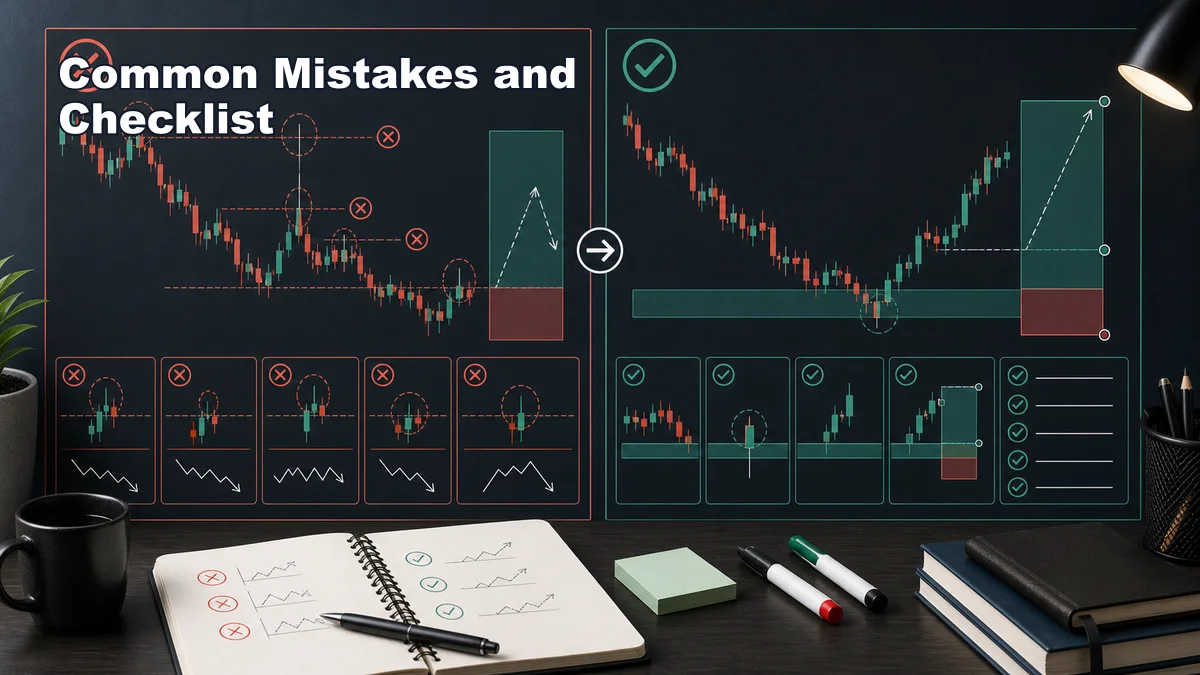
The biggest mistake is treating every wick as rejection. A wick can show rejection, liquidity sweep, volatility, news reaction, or simple indecision. The wick needs context before it becomes useful.
- Trading rejection away from a clean zone: the candle matters because of where it forms.
- Ignoring the candle close: a wick with a weak close may not show real control.
- Entering before the candle finishes: an unfinished rejection can disappear before the close.
- Forgetting higher-timeframe pressure: a rejection against a strong trend may need extra confirmation.
- Using stops without invalidation: stop placement should match the reason for the trade.
- Chasing large rejection candles: a large candle can make the entry late and the stop too wide.
- Calling every failed trade a fakeout: sometimes the setup was simply invalid or poorly located.
Use this checklist before entry:
- Is price at a meaningful MSNR support or resistance zone?
- Did price attempt to move beyond the zone?
- Did the candle close in a way that rejects that attempt?
- Does the higher timeframe support or warn against the trade?
- Is the next candle or lower-timeframe structure confirming the idea?
- Where is the setup invalid?
- Does the stop-loss location match invalidation?
- Is there enough room to the next opposing zone?
- Will you journal the setup whether it wins or loses?
Download the MSNR Checklist: Use this rejection-candle checklist beside the full MSNR trading strategy guide. The core sequence is simple: zone first, rejection second, invalidation third, risk always.
FAQ
What is an MSNR rejection candle?
An MSNR rejection candle is a candle that tests a support or resistance zone, fails to hold beyond it, and closes in a way that suggests the zone may still be active.
How do I know if a rejection candle is real?
A stronger rejection usually forms at a clean zone, aligns with context, closes back away from the failed move, has follow-through, and provides a clear invalidation point.
Is a long wick always a rejection?
No. A long wick can show rejection, volatility, a liquidity sweep, or indecision. It needs zone context, candle close, and risk logic before it becomes a trade signal.
Where should the stop loss go after a rejection candle?
The stop loss should sit around the point where the rejection idea is wrong, such as beyond the wick, beyond the zone, or beyond the reaction swing, depending on your tested rule.
Connect this setup to the wider framework
A rejection candle is only one part of the decision. Define the area through MSNR drawing rules, label zone quality, and compare the candle with candlestick context.
Then require evidence from MSNR close-based confirmation, market structure, and zone invalidation before classifying the bounce.
Sources and limits
General market-risk and technical-analysis references:
Strategy labels and chart examples are interpretive; they are not standardized signals and do not guarantee outcomes.